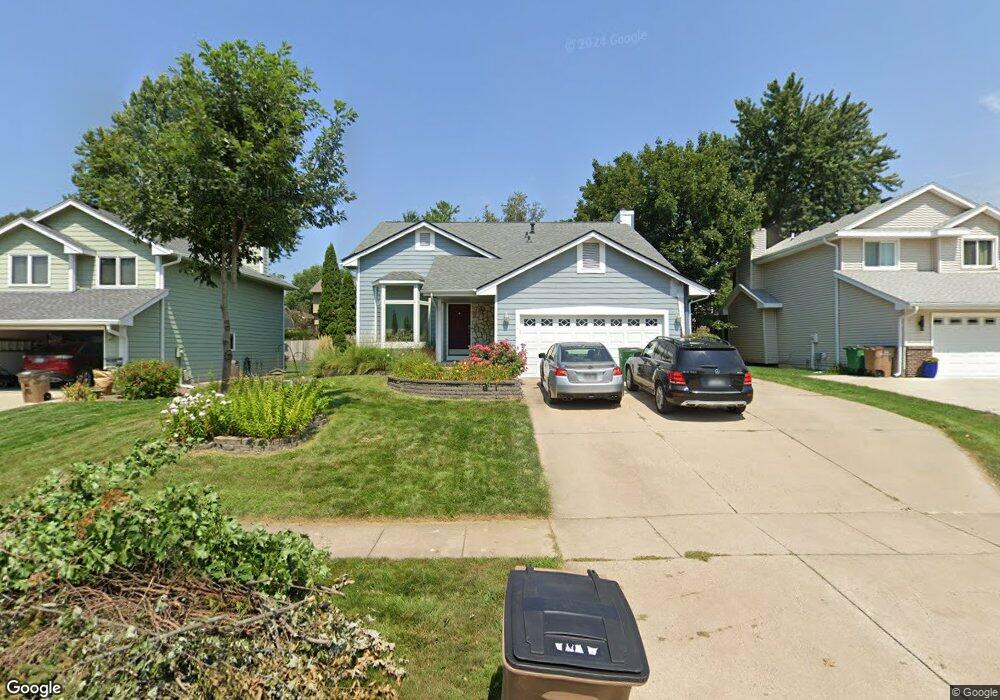
2813 Walnut St West Des Moines, IA 50265
Estimated Value: $348,000 - $363,000
3
Beds
3
Baths
1,808
Sq Ft
$195/Sq Ft
Est. Value
About This Home
This home is located at 2813 Walnut St, West Des Moines, IA 50265 and is currently estimated at $352,547, approximately $194 per square foot. 2813 Walnut St is a home located in Polk County with nearby schools including Fairmeadows Elementary School, Stilwell Junior High School, and Valley Southwoods Freshman High School.
Ownership History
Date
Name
Owned For
Owner Type
Purchase Details
Closed on
Jun 8, 2011
Sold by
Buelow Timothy C
Bought by
Buelow Timothy C and Buelow Heidi J
Current Estimated Value
Purchase Details
Closed on
Nov 23, 1998
Sold by
Jones Roger Alan and Matise Jones Deborah Ann
Bought by
Buelow Timothy C
Home Financials for this Owner
Home Financials are based on the most recent Mortgage that was taken out on this home.
Original Mortgage
$118,640
Outstanding Balance
$26,855
Interest Rate
7.01%
Estimated Equity
$325,692
Create a Home Valuation Report for This Property
The Home Valuation Report is an in-depth analysis detailing your home's value as well as a comparison with similar homes in the area
Home Values in the Area
Average Home Value in this Area
Purchase History
| Date | Buyer | Sale Price | Title Company |
|---|---|---|---|
| Buelow Timothy C | -- | None Available | |
| Buelow Timothy C | $148,000 | -- |
Source: Public Records
Mortgage History
| Date | Status | Borrower | Loan Amount |
|---|---|---|---|
| Open | Buelow Timothy C | $118,640 |
Source: Public Records
Tax History Compared to Growth
Tax History
| Year | Tax Paid | Tax Assessment Tax Assessment Total Assessment is a certain percentage of the fair market value that is determined by local assessors to be the total taxable value of land and additions on the property. | Land | Improvement |
|---|---|---|---|---|
| 2025 | $4,996 | $362,500 | $64,300 | $298,200 |
| 2024 | $4,996 | $325,700 | $57,100 | $268,600 |
| 2023 | $4,878 | $325,700 | $57,100 | $268,600 |
| 2022 | $4,818 | $261,500 | $46,800 | $214,700 |
| 2021 | $4,834 | $261,500 | $46,800 | $214,700 |
| 2020 | $4,756 | $249,600 | $44,600 | $205,000 |
| 2019 | $4,514 | $249,600 | $44,600 | $205,000 |
| 2018 | $4,522 | $228,900 | $40,200 | $188,700 |
| 2017 | $4,226 | $228,900 | $40,200 | $188,700 |
| 2016 | $4,130 | $208,400 | $36,100 | $172,300 |
| 2015 | $4,130 | $208,400 | $36,100 | $172,300 |
| 2014 | $3,548 | $183,900 | $31,200 | $152,700 |
Source: Public Records
Map
Nearby Homes