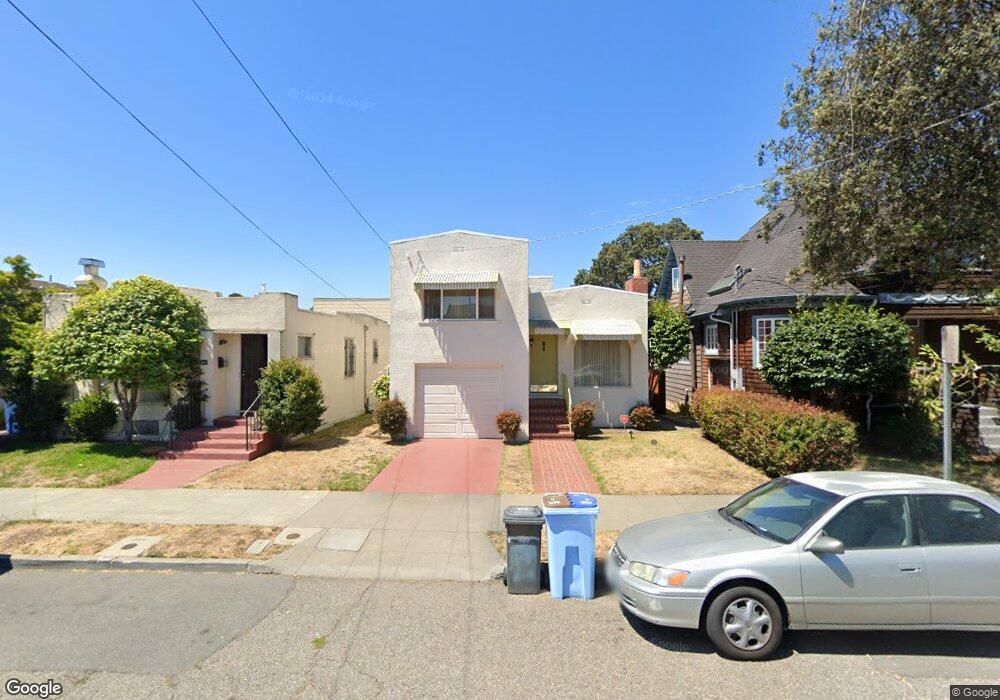
2814 Acton St Berkeley, CA 94702
West Berkeley NeighborhoodEstimated Value: $1,014,940 - $1,264,000
3
Beds
2
Baths
1,395
Sq Ft
$841/Sq Ft
Est. Value
About This Home
This home is located at 2814 Acton St, Berkeley, CA 94702 and is currently estimated at $1,172,735, approximately $840 per square foot. 2814 Acton St is a home located in Alameda County with nearby schools including Malcolm X Elementary School, Washington Elementary School, and Oxford Elementary School.
Ownership History
Date
Name
Owned For
Owner Type
Purchase Details
Closed on
Sep 26, 2023
Sold by
Givens Merian M
Bought by
Givens Family Trust and Givens
Current Estimated Value
Purchase Details
Closed on
Nov 27, 2017
Sold by
Givens Merian M
Bought by
Givens Merian and Givens Family Trust
Purchase Details
Closed on
Jul 27, 2017
Sold by
Givens Merian M
Bought by
Givens Merian M and Stapleton Tiffany N
Purchase Details
Closed on
May 13, 2004
Sold by
Givens James L and Givens Merian M
Bought by
Givens James L and Givens Merian M
Create a Home Valuation Report for This Property
The Home Valuation Report is an in-depth analysis detailing your home's value as well as a comparison with similar homes in the area
Home Values in the Area
Average Home Value in this Area
Purchase History
| Date | Buyer | Sale Price | Title Company |
|---|---|---|---|
| Givens Family Trust | -- | None Listed On Document | |
| Givens Merian M | -- | None Listed On Document | |
| Givens Merian | -- | None Available | |
| Givens Merian M | -- | None Available | |
| Givens James L | -- | -- |
Source: Public Records
Tax History
| Year | Tax Paid | Tax Assessment Tax Assessment Total Assessment is a certain percentage of the fair market value that is determined by local assessors to be the total taxable value of land and additions on the property. | Land | Improvement |
|---|---|---|---|---|
| 2025 | $3,932 | $51,106 | $24,272 | $33,834 |
| 2024 | $3,932 | $49,967 | $23,796 | $33,171 |
| 2023 | $3,763 | $55,850 | $23,330 | $32,520 |
| 2022 | $3,574 | $47,755 | $22,872 | $31,883 |
| 2021 | $3,539 | $46,682 | $22,424 | $31,258 |
| 2020 | $3,242 | $53,131 | $22,194 | $30,937 |
| 2019 | $2,984 | $52,090 | $21,759 | $30,331 |
| 2018 | $2,886 | $51,068 | $21,332 | $29,736 |
| 2017 | $2,749 | $50,067 | $20,914 | $29,153 |
| 2016 | $2,552 | $49,086 | $20,504 | $28,582 |
| 2015 | $2,494 | $48,348 | $20,196 | $28,152 |
| 2014 | $2,427 | $47,401 | $19,800 | $27,601 |
Source: Public Records
Map
Nearby Homes
- 2922 Stanton St
- 2790 Sacramento St
- 1314 Ashby Ave
- 2782 Sacramento St
- 2774 Sacramento St
- 2758 Sacramento St
- 1450 Ward St
- 2717 Mabel St
- 2750 Sacramento St
- 1237 Ashby Ave
- 2751 Wallace St
- 1535 Julia St
- 3032 Mabel St
- 2829 California St
- 1515 Derby St
- 1507 Prince St
- 3101 Sacramento St
- 1034 Grayson St
- 1080 67th St
- 1010 Grayson St
Your Personal Tour Guide
Ask me questions while you tour the home.