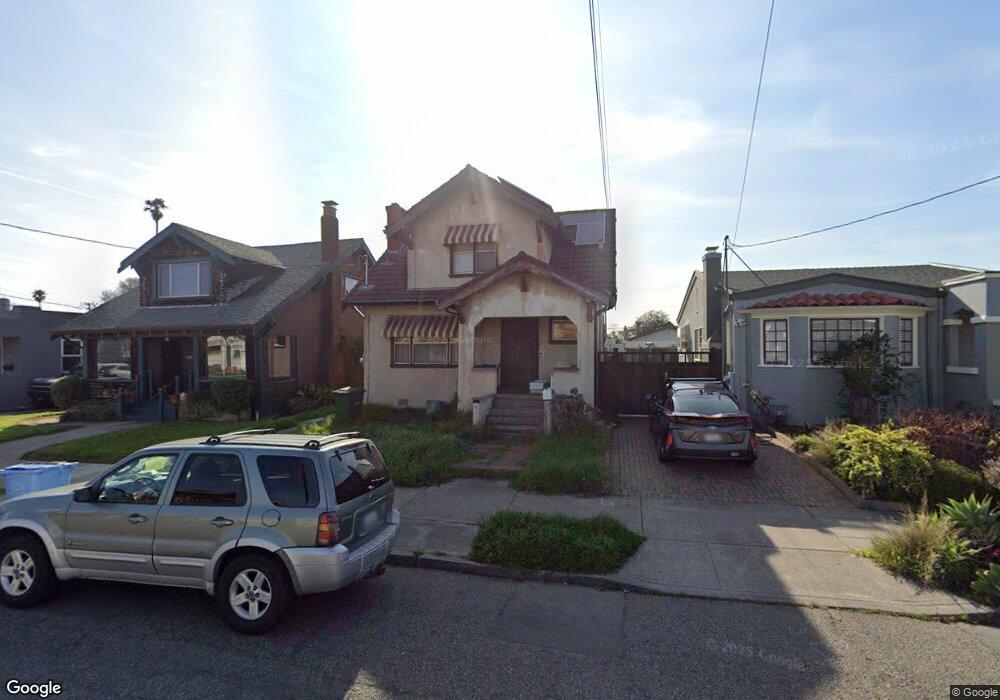
2814 Dohr St Berkeley, CA 94702
West Berkeley NeighborhoodEstimated Value: $1,034,000 - $1,174,000
2
Beds
2
Baths
1,416
Sq Ft
$790/Sq Ft
Est. Value
About This Home
This home is located at 2814 Dohr St, Berkeley, CA 94702 and is currently estimated at $1,119,298, approximately $790 per square foot. 2814 Dohr St is a home located in Alameda County with nearby schools including Malcolm X Elementary School, Washington Elementary School, and Oxford Elementary School.
Ownership History
Date
Name
Owned For
Owner Type
Purchase Details
Closed on
Jan 27, 1994
Sold by
Rifas Susan B
Bought by
Sakata Kean Y
Current Estimated Value
Home Financials for this Owner
Home Financials are based on the most recent Mortgage that was taken out on this home.
Original Mortgage
$81,000
Interest Rate
7.19%
Create a Home Valuation Report for This Property
The Home Valuation Report is an in-depth analysis detailing your home's value as well as a comparison with similar homes in the area
Home Values in the Area
Average Home Value in this Area
Purchase History
| Date | Buyer | Sale Price | Title Company |
|---|---|---|---|
| Sakata Kean Y | $40,500 | Fidelity National Title |
Source: Public Records
Mortgage History
| Date | Status | Borrower | Loan Amount |
|---|---|---|---|
| Closed | Sakata Kean Y | $81,000 |
Source: Public Records
Tax History
| Year | Tax Paid | Tax Assessment Tax Assessment Total Assessment is a certain percentage of the fair market value that is determined by local assessors to be the total taxable value of land and additions on the property. | Land | Improvement |
|---|---|---|---|---|
| 2025 | $6,222 | $221,280 | $58,569 | $169,711 |
| 2024 | $6,222 | $216,804 | $57,421 | $166,383 |
| 2023 | $6,020 | $219,416 | $56,295 | $163,121 |
| 2022 | $6,024 | $208,114 | $55,191 | $159,923 |
| 2021 | $6,004 | $203,896 | $54,109 | $156,787 |
| 2020 | $5,638 | $208,734 | $53,554 | $155,180 |
| 2019 | $5,347 | $204,641 | $52,504 | $152,137 |
| 2018 | $5,207 | $200,630 | $51,475 | $149,155 |
| 2017 | $4,998 | $196,697 | $50,466 | $146,231 |
| 2016 | $4,755 | $192,840 | $49,476 | $143,364 |
| 2015 | $4,665 | $189,944 | $48,733 | $141,211 |
| 2014 | $4,583 | $186,224 | $47,779 | $138,445 |
Source: Public Records
Map
Nearby Homes
- 2922 Stanton St
- 2790 Sacramento St
- 2782 Sacramento St
- 3000 Acton St
- 2774 Sacramento St
- 2758 Sacramento St
- 1450 Ward St
- 2750 Sacramento St
- 1314 Ashby Ave
- 2717 Mabel St
- 2829 California St
- 1538 Ashby Ave
- 1237 Ashby Ave
- 1515 Derby St
- 1507 Prince St
- 3032 Mabel St
- 3101 Sacramento St
- 3114 California St
- 1080 67th St
- 1034 Grayson St
Your Personal Tour Guide
Ask me questions while you tour the home.