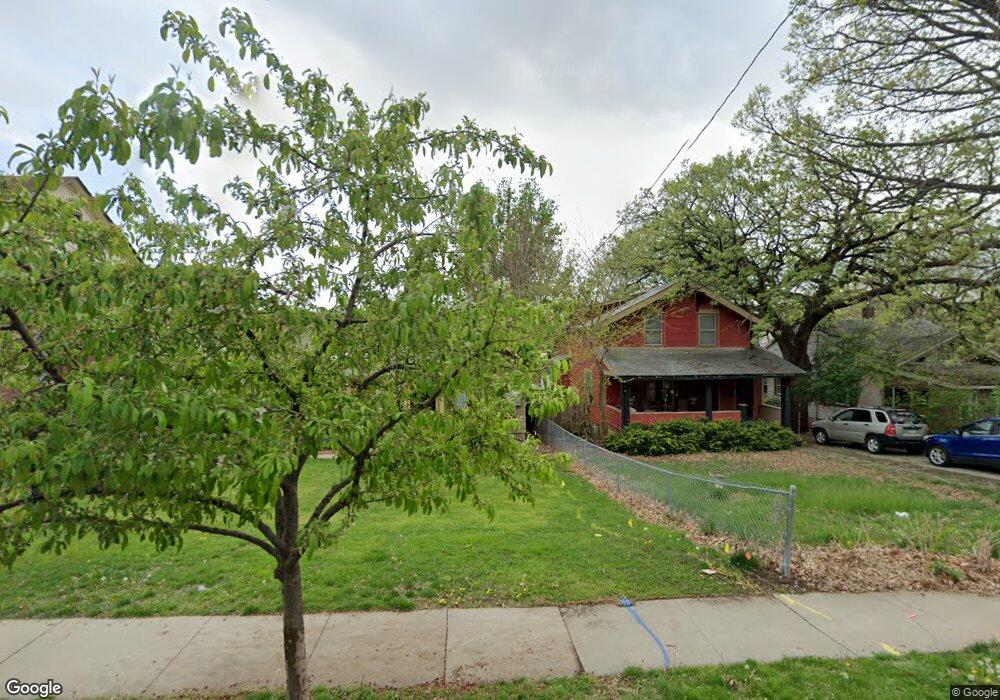
2814 High St Des Moines, IA 50312
Woodland Heights NeighborhoodEstimated Value: $223,000 - $262,000
2
Beds
1
Bath
1,634
Sq Ft
$149/Sq Ft
Est. Value
About This Home
This home is located at 2814 High St, Des Moines, IA 50312 and is currently estimated at $244,201, approximately $149 per square foot. 2814 High St is a home located in Polk County with nearby schools including Greenwood Elementary School, Roosevelt High School, and St Augustin Catholic School.
Ownership History
Date
Name
Owned For
Owner Type
Purchase Details
Closed on
Jun 9, 1999
Sold by
Home Buying Solutions Llc
Bought by
Murphy Matthew James and Lutrell Murphy Maria Antoinette
Current Estimated Value
Home Financials for this Owner
Home Financials are based on the most recent Mortgage that was taken out on this home.
Original Mortgage
$94,952
Outstanding Balance
$24,432
Interest Rate
6.99%
Mortgage Type
FHA
Estimated Equity
$219,769
Purchase Details
Closed on
May 9, 1999
Sold by
Rocky Mountain Property Investments Inc
Bought by
Home Buying Solutions Llc
Home Financials for this Owner
Home Financials are based on the most recent Mortgage that was taken out on this home.
Original Mortgage
$94,952
Outstanding Balance
$24,432
Interest Rate
6.99%
Mortgage Type
FHA
Estimated Equity
$219,769
Purchase Details
Closed on
Jan 4, 1999
Sold by
City Of Des Moines
Bought by
Severson Betty D
Purchase Details
Closed on
Dec 11, 1998
Sold by
Severson Betty D
Bought by
Rocky Mountain Property Investments Inc
Create a Home Valuation Report for This Property
The Home Valuation Report is an in-depth analysis detailing your home's value as well as a comparison with similar homes in the area
Home Values in the Area
Average Home Value in this Area
Purchase History
| Date | Buyer | Sale Price | Title Company |
|---|---|---|---|
| Murphy Matthew James | $94,500 | -- | |
| Home Buying Solutions Llc | $81,500 | -- | |
| Severson Betty D | -- | -- | |
| Rocky Mountain Property Investments Inc | -- | -- | |
| Rocky Mountain Property Investments Inc | $34,500 | -- |
Source: Public Records
Mortgage History
| Date | Status | Borrower | Loan Amount |
|---|---|---|---|
| Open | Murphy Matthew James | $94,952 |
Source: Public Records
Tax History Compared to Growth
Tax History
| Year | Tax Paid | Tax Assessment Tax Assessment Total Assessment is a certain percentage of the fair market value that is determined by local assessors to be the total taxable value of land and additions on the property. | Land | Improvement |
|---|---|---|---|---|
| 2025 | $4,002 | $223,400 | $47,200 | $176,200 |
| 2024 | $4,002 | $213,900 | $45,000 | $168,900 |
| 2023 | $3,830 | $213,900 | $45,000 | $168,900 |
| 2022 | $3,800 | $171,400 | $37,200 | $134,200 |
| 2021 | $3,592 | $171,400 | $37,200 | $134,200 |
| 2020 | $3,726 | $152,500 | $33,400 | $119,100 |
| 2019 | $3,482 | $152,500 | $33,400 | $119,100 |
| 2018 | $3,442 | $138,100 | $29,900 | $108,200 |
| 2017 | $3,120 | $138,100 | $29,900 | $108,200 |
| 2016 | $3,036 | $123,900 | $26,800 | $97,100 |
| 2015 | $3,036 | $123,900 | $26,800 | $97,100 |
| 2014 | $2,752 | $112,300 | $24,100 | $88,200 |
Source: Public Records
Map
Nearby Homes
- 2723 Linden St
- 2928 High St
- 2901 Grand Ave Unit 103
- 2901 Grand Ave Unit 107
- 644 26th St
- 2880 Grand Ave Unit 102
- 646 25th St
- 3103 Grand Ave
- 3117 Grand Ave
- 684 31st St
- 710 31st St
- 3308 Crescent Dr
- 3117 Pleasant St
- 2510 Forest Dr
- 2512 Forest Dr
- 714 32nd St
- 829 29th St
- 838 29th St
- 2203 High St
- 310 31st St