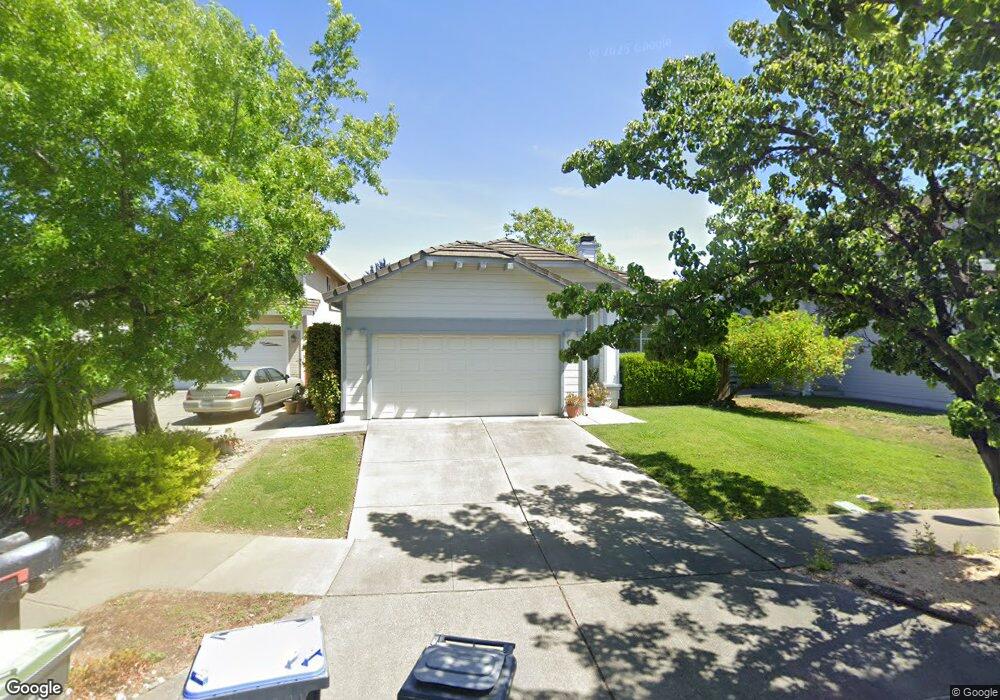
2814 Hillview Ct Fairfield, CA 94534
Estimated Value: $535,000 - $574,000
3
Beds
2
Baths
1,332
Sq Ft
$415/Sq Ft
Est. Value
About This Home
This home is located at 2814 Hillview Ct, Fairfield, CA 94534 and is currently estimated at $552,116, approximately $414 per square foot. 2814 Hillview Ct is a home located in Solano County with nearby schools including Rolling Hills Elementary School, Fairfield High School, and Solano Christian Academy.
Ownership History
Date
Name
Owned For
Owner Type
Purchase Details
Closed on
Dec 6, 2012
Sold by
Johnson Annie Jo
Bought by
Johnson Annie Jo
Current Estimated Value
Home Financials for this Owner
Home Financials are based on the most recent Mortgage that was taken out on this home.
Original Mortgage
$159,000
Outstanding Balance
$110,057
Interest Rate
3.35%
Mortgage Type
New Conventional
Estimated Equity
$442,059
Purchase Details
Closed on
Aug 2, 2000
Sold by
Schrock Paul and Schrock Tiffany Ann
Bought by
Johnson Billy T and Johnson Annie Jo
Home Financials for this Owner
Home Financials are based on the most recent Mortgage that was taken out on this home.
Original Mortgage
$206,250
Interest Rate
8.19%
Mortgage Type
Stand Alone First
Purchase Details
Closed on
Sep 11, 1996
Sold by
Oceanis
Bought by
Shrock Paul and Shrock Tiffany Ann
Home Financials for this Owner
Home Financials are based on the most recent Mortgage that was taken out on this home.
Original Mortgage
$124,644
Interest Rate
8.23%
Create a Home Valuation Report for This Property
The Home Valuation Report is an in-depth analysis detailing your home's value as well as a comparison with similar homes in the area
Home Values in the Area
Average Home Value in this Area
Purchase History
| Date | Buyer | Sale Price | Title Company |
|---|---|---|---|
| Johnson Annie Jo | -- | Lsi | |
| Johnson Annie Jo | -- | Lsi Title Company | |
| Johnson Billy T | $220,000 | Placer Title Company | |
| Shrock Paul | $156,000 | Frontier Title |
Source: Public Records
Mortgage History
| Date | Status | Borrower | Loan Amount |
|---|---|---|---|
| Open | Johnson Annie Jo | $159,000 | |
| Closed | Johnson Billy T | $206,250 | |
| Previous Owner | Shrock Paul | $124,644 |
Source: Public Records
Tax History Compared to Growth
Tax History
| Year | Tax Paid | Tax Assessment Tax Assessment Total Assessment is a certain percentage of the fair market value that is determined by local assessors to be the total taxable value of land and additions on the property. | Land | Improvement |
|---|---|---|---|---|
| 2025 | $4,051 | $331,491 | $97,937 | $233,554 |
| 2024 | $4,051 | $324,992 | $96,017 | $228,975 |
| 2023 | $3,936 | $318,621 | $94,135 | $224,486 |
| 2022 | $3,929 | $312,375 | $92,290 | $220,085 |
| 2021 | $3,891 | $306,251 | $90,481 | $215,770 |
| 2020 | $3,942 | $303,112 | $89,554 | $213,558 |
| 2019 | $3,858 | $297,170 | $87,799 | $209,371 |
| 2018 | $3,938 | $291,344 | $86,078 | $205,266 |
| 2017 | $3,899 | $285,633 | $84,391 | $201,242 |
| 2016 | $3,869 | $280,034 | $82,737 | $197,297 |
| 2015 | $3,653 | $275,829 | $81,495 | $194,334 |
| 2014 | $3,622 | $270,427 | $79,899 | $190,528 |
Source: Public Records
Map
Nearby Homes
- 2775 Parkview Terrace
- 2220 Fox Glen Dr
- 120 Goya Dr
- 121 Goya Dr
- 2156 Fox Glen Dr
- 42 Goya Dr
- 41 Goya Dr
- 2225 Hillridge Dr
- 32 Goya Dr
- 15 Dali Ct
- 2320 Sanctuary Dr
- 2420 Topgallant Ct
- 3501 Sunny Hill Ct
- 2133 Hillridge Dr
- 2335 Fairview Place
- 2347 Fairview Place
- 2806 Marigold Dr
- 2734 Laurel Dr
- 2657 Marigold Dr
- 2503 China Ct
- 2810 Hillview Ct
- 2818 Hillview Ct
- 2806 Hillview Ct
- 2822 Hillview Ct
- 2805 Parkview Terrace
- 2801 Parkview Terrace
- 2826 Hillview Ct
- 2809 Parkview Terrace
- 2811 Hillview Ct
- 2807 Hillview Ct
- 2815 Hillview Ct
- 2803 Hillview Ct
- 2365 Mountain View Ct
- 2819 Hillview Ct
- 2361 Mountain View Ct
- 2800 Hillview Dr
- 2357 Mountain View Ct
- 2813 Parkview Terrace
- 2353 Mountain View Ct
- 2795 Parkview Terrace