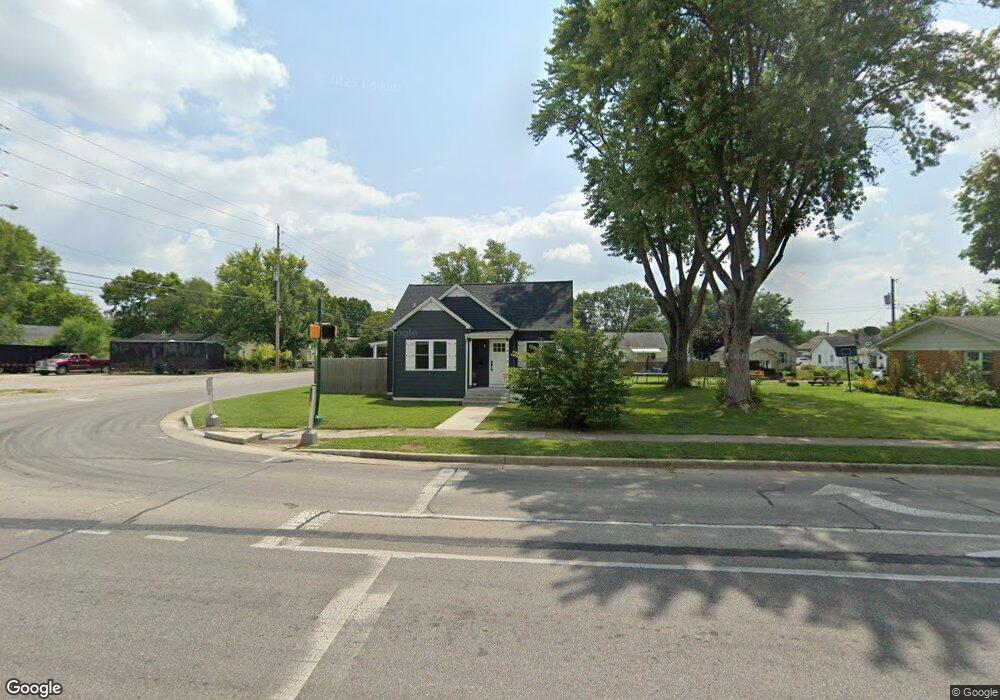
2815 17th St Columbus, IN 47201
Estimated Value: $146,000 - $233,000
3
Beds
2
Baths
2,210
Sq Ft
$88/Sq Ft
Est. Value
About This Home
This home is located at 2815 17th St, Columbus, IN 47201 and is currently estimated at $194,512, approximately $88 per square foot. 2815 17th St is a home located in Bartholomew County with nearby schools including L.F. Smith Elementary School, Central Middle School, and Columbus East High School.
Ownership History
Date
Name
Owned For
Owner Type
Purchase Details
Closed on
Apr 14, 2021
Sold by
Connections Unlimited Llc
Bought by
Homes By Keeno Llc
Current Estimated Value
Purchase Details
Closed on
Aug 6, 2010
Sold by
Federal National Mortgage Association
Bought by
Connections Unlimited Llc
Purchase Details
Closed on
Jan 21, 2010
Sold by
Countrywide Home Loans Servici
Bought by
Federal National Mortgage Association
Purchase Details
Closed on
Oct 31, 2005
Sold by
Brockman Vanessa L
Bought by
Davis Harold and Davis Vanessa
Purchase Details
Closed on
Aug 21, 2003
Sold by
Brockman Mark W and Brockman Vanessa L
Bought by
Brockman Vanessa L
Create a Home Valuation Report for This Property
The Home Valuation Report is an in-depth analysis detailing your home's value as well as a comparison with similar homes in the area
Home Values in the Area
Average Home Value in this Area
Purchase History
| Date | Buyer | Sale Price | Title Company |
|---|---|---|---|
| Homes By Keeno Llc | $45,000 | None Available | |
| Connections Unlimited Llc | $50,000 | -- | |
| Connections Unlimited Llc | $50,000 | -- | |
| Federal National Mortgage Association | $110,948 | -- | |
| Davis Harold | -- | None Available | |
| Brockman Vanessa L | -- | -- |
Source: Public Records
Tax History Compared to Growth
Tax History
| Year | Tax Paid | Tax Assessment Tax Assessment Total Assessment is a certain percentage of the fair market value that is determined by local assessors to be the total taxable value of land and additions on the property. | Land | Improvement |
|---|---|---|---|---|
| 2024 | $4,333 | $129,200 | $18,800 | $110,400 |
| 2023 | $2,596 | $114,300 | $18,800 | $95,500 |
| 2022 | $782 | $34,500 | $18,800 | $15,700 |
| 2021 | $2,284 | $99,900 | $13,600 | $86,300 |
| 2020 | $2,319 | $101,600 | $13,600 | $88,000 |
| 2019 | $2,166 | $101,500 | $13,600 | $87,900 |
| 2018 | $2,475 | $97,600 | $13,600 | $84,000 |
| 2017 | $2,090 | $95,900 | $12,400 | $83,500 |
| 2016 | $2,035 | $93,100 | $12,400 | $80,700 |
| 2014 | $2,140 | $96,000 | $12,400 | $83,600 |
Source: Public Records
Map
Nearby Homes