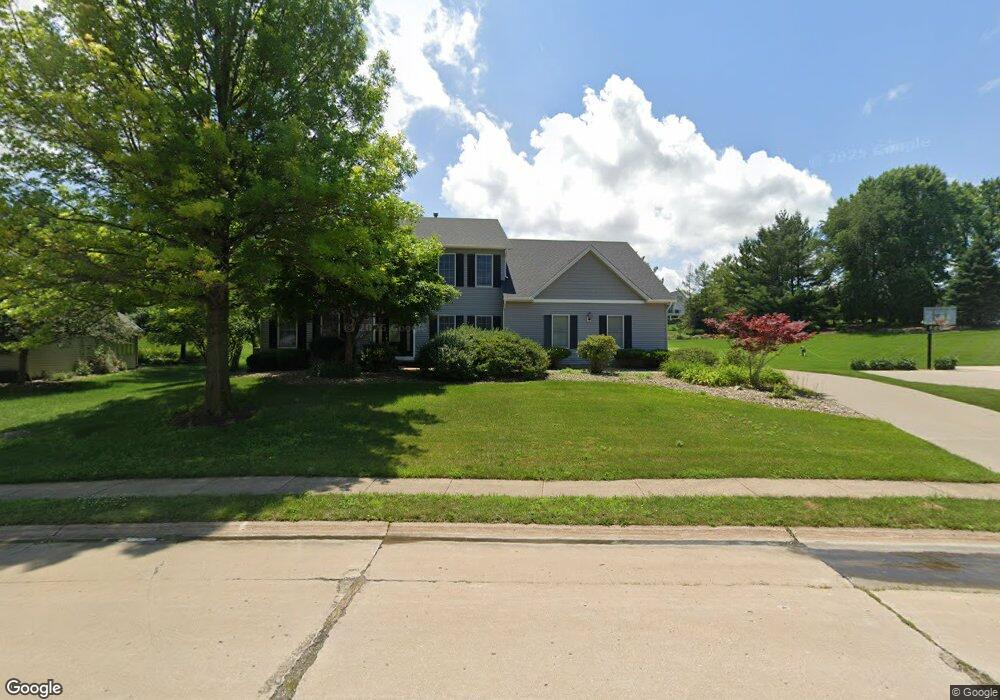
2815 E 43rd St Davenport, IA 52807
North Side NeighborhoodEstimated Value: $494,730 - $526,000
4
Beds
8
Baths
3,308
Sq Ft
$154/Sq Ft
Est. Value
About This Home
This home is located at 2815 E 43rd St, Davenport, IA 52807 and is currently estimated at $508,433, approximately $153 per square foot. 2815 E 43rd St is a home located in Scott County with nearby schools including Eisenhower Elementary School, Sudlow Intermediate School, and Central High School.
Ownership History
Date
Name
Owned For
Owner Type
Purchase Details
Closed on
Jun 6, 2023
Sold by
Schnoor James K
Bought by
Biskie Joel A and Biskie Jennifer
Current Estimated Value
Home Financials for this Owner
Home Financials are based on the most recent Mortgage that was taken out on this home.
Original Mortgage
$461,487
Outstanding Balance
$448,655
Interest Rate
6.39%
Mortgage Type
FHA
Estimated Equity
$59,778
Create a Home Valuation Report for This Property
The Home Valuation Report is an in-depth analysis detailing your home's value as well as a comparison with similar homes in the area
Home Values in the Area
Average Home Value in this Area
Purchase History
| Date | Buyer | Sale Price | Title Company |
|---|---|---|---|
| Biskie Joel A | $470,000 | None Listed On Document |
Source: Public Records
Mortgage History
| Date | Status | Borrower | Loan Amount |
|---|---|---|---|
| Open | Biskie Joel A | $461,487 |
Source: Public Records
Tax History
| Year | Tax Paid | Tax Assessment Tax Assessment Total Assessment is a certain percentage of the fair market value that is determined by local assessors to be the total taxable value of land and additions on the property. | Land | Improvement |
|---|---|---|---|---|
| 2025 | $7,438 | $473,360 | $62,950 | $410,410 |
| 2024 | $6,748 | $426,450 | $62,950 | $363,500 |
| 2023 | $7,212 | $397,370 | $62,950 | $334,420 |
| 2022 | $7,244 | $346,550 | $56,950 | $289,600 |
| 2021 | $7,244 | $346,550 | $56,950 | $289,600 |
| 2020 | $7,338 | $329,520 | $56,950 | $272,570 |
| 2019 | $7,584 | $346,550 | $56,950 | $289,600 |
| 2018 | $7,420 | $346,550 | $56,950 | $289,600 |
| 2017 | $7,298 | $346,550 | $56,950 | $289,600 |
| 2016 | $7,026 | $329,520 | $0 | $0 |
| 2015 | $7,026 | $307,880 | $0 | $0 |
| 2014 | $6,644 | $309,650 | $0 | $0 |
| 2013 | $6,564 | $0 | $0 | $0 |
| 2012 | -- | $306,110 | $51,800 | $254,310 |
Source: Public Records
Map
Nearby Homes
- 2919 E 44th Ct
- 4709 Pheasant Creek Ave
- 3730 Kenwood Ave
- 4732 Pheasant Creek Ave
- 5002 Fairhaven Rd
- 4320 Belle Ave
- 3818 Belle Ave
- 0 E 53rd St Unit Lot 4
- 3750 Market Square Cir
- 0 Eastern Unit MRDQC4247043
- 2515 E George Washington Blvd
- 4029 Denniston Ct
- 3618 Magnolia Ct
- 0 Golden Valley Dr
- 5811 Duggleby Ave
- 280 Mason Dr
- 237 Mason Dr
- 4220 E 48th St
- 1680 Prairie Vista Cir
- 2704 Magnolia Dr
Your Personal Tour Guide
Ask me questions while you tour the home.