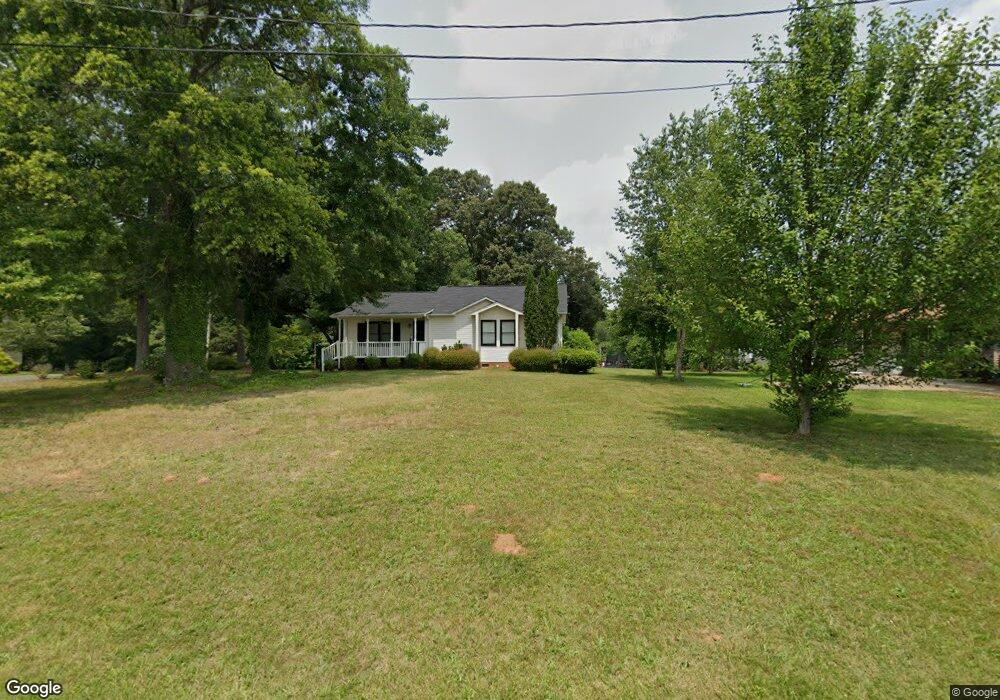
28159 Poplins Grove Church Rd Unit A Albemarle, NC 28001
Estimated Value: $258,720 - $315,000
2
Beds
2
Baths
1,336
Sq Ft
$211/Sq Ft
Est. Value
About This Home
This home is located at 28159 Poplins Grove Church Rd Unit A, Albemarle, NC 28001 and is currently estimated at $282,430, approximately $211 per square foot. 28159 Poplins Grove Church Rd Unit A is a home located in Stanly County with nearby schools including Endy Elementary School, West Stanly Middle School, and West Stanly High School.
Ownership History
Date
Name
Owned For
Owner Type
Purchase Details
Closed on
Aug 18, 2017
Sold by
Lee Lauren T and Tingle Tyler Lee
Bought by
Ledezma Isabel and Ledezma Cristobal
Current Estimated Value
Purchase Details
Closed on
Dec 19, 2014
Sold by
Morton David M and Morton Rebecca A
Bought by
Lee Lauren T
Home Financials for this Owner
Home Financials are based on the most recent Mortgage that was taken out on this home.
Original Mortgage
$115,500
Interest Rate
4.5%
Mortgage Type
New Conventional
Purchase Details
Closed on
Nov 14, 2011
Sold by
Sowell Robin E Reid and Sowell Lee E
Bought by
Morton David M and Morton Rebecca A
Home Financials for this Owner
Home Financials are based on the most recent Mortgage that was taken out on this home.
Original Mortgage
$103,500
Interest Rate
4.75%
Mortgage Type
New Conventional
Create a Home Valuation Report for This Property
The Home Valuation Report is an in-depth analysis detailing your home's value as well as a comparison with similar homes in the area
Home Values in the Area
Average Home Value in this Area
Purchase History
| Date | Buyer | Sale Price | Title Company |
|---|---|---|---|
| Ledezma Isabel | $134,000 | Attorney | |
| Lee Lauren T | $114,000 | None Available | |
| Morton David M | $104,000 | None Available |
Source: Public Records
Mortgage History
| Date | Status | Borrower | Loan Amount |
|---|---|---|---|
| Previous Owner | Lee Lauren T | $115,500 | |
| Previous Owner | Morton David M | $103,500 |
Source: Public Records
Tax History Compared to Growth
Tax History
| Year | Tax Paid | Tax Assessment Tax Assessment Total Assessment is a certain percentage of the fair market value that is determined by local assessors to be the total taxable value of land and additions on the property. | Land | Improvement |
|---|---|---|---|---|
| 2025 | $1,103 | $175,042 | $26,613 | $148,429 |
| 2024 | $950 | $130,100 | $19,516 | $110,584 |
| 2023 | $924 | $130,100 | $19,516 | $110,584 |
| 2022 | $924 | $130,100 | $19,516 | $110,584 |
| 2021 | $924 | $130,100 | $19,516 | $110,584 |
| 2020 | $863 | $113,238 | $17,742 | $95,496 |
| 2019 | $872 | $113,238 | $17,742 | $95,496 |
| 2018 | $827 | $113,238 | $17,742 | $95,496 |
| 2017 | $827 | $113,238 | $17,742 | $95,496 |
| 2016 | $736 | $100,826 | $15,968 | $84,858 |
| 2015 | $744 | $100,826 | $15,968 | $84,858 |
| 2014 | $811 | $100,826 | $15,968 | $84,858 |
Source: Public Records
Map
Nearby Homes
- 203 Poplins Grove Church Rd
- 2124 W Main St Unit C
- 420 Brookwood Ave
- 2104 Hillcrest Ave
- 2206 Hillcrest Ave
- 00000 Saint Martin Rd
- 620 Central Ave
- 1806 Kingsley Dr
- 00 NE Connector Bypass
- 1724 Lowder St
- 1610 Lowder St
- 623 Coble Ave
- Plan 3320 at Crystal Village
- Plan 1709 at Crystal Village
- Plan 2307 at Crystal Village
- Plan 2131 at Crystal Village
- 63 Calle de Castello Unit 6
- 200 Fostoria Place Unit 78A
- 2909 Waterford Ln Unit 35 A
- 202 Fostoria Place Unit 78B
- 28159 Poplins Grove Church Rd Unit B
- 28159 Poplins Grove Church Rd
- 28175 Poplins Grove Church Rd
- 28147 Poplins Grove Church Rd
- 28135 Poplins Grove Church Rd
- 2707 Parkwest Dr
- 2707 Park West Dr
- 2709 Park West Dr
- 2705 Park West Dr
- 212 Anderson Rd Unit 8
- 212 Anderson Rd
- 208 Anderson Rd
- 2703 Park West Dr
- 2801 Park West Dr
- 2701 Park West Dr
- 2803 Parkwest Dr
- 2613 Parkwest Dr
- 2613 Parkwest Dr Unit 7
- 2613 Park West Dr
- 2611 Parkwest Dr