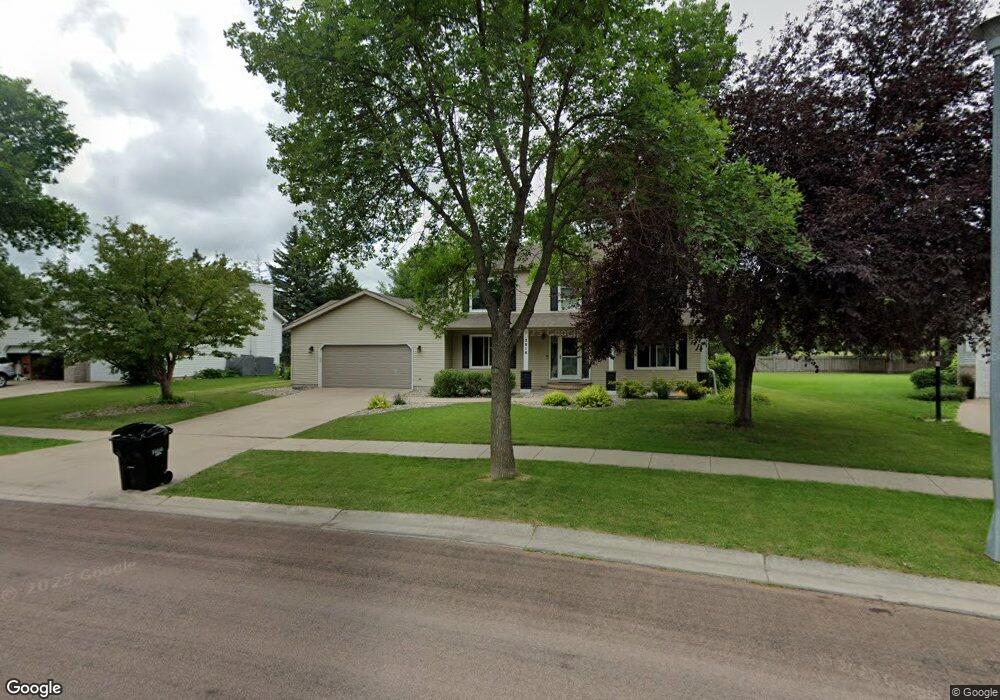
2816 39 1/2 Ave S Fargo, ND 58104
Stonebridge NeighborhoodEstimated Value: $482,000 - $498,000
5
Beds
3
Baths
3,338
Sq Ft
$147/Sq Ft
Est. Value
About This Home
This home is located at 2816 39 1/2 Ave S, Fargo, ND 58104 and is currently estimated at $489,141, approximately $146 per square foot. 2816 39 1/2 Ave S is a home located in Cass County with nearby schools including Centennial Elementary School, Discovery Middle School, and Fargo Davies High School.
Ownership History
Date
Name
Owned For
Owner Type
Purchase Details
Closed on
Dec 11, 2024
Sold by
Scott Andrew and Scott Alexis L
Bought by
Lysne-Burson Desserre and Burson Paul
Current Estimated Value
Home Financials for this Owner
Home Financials are based on the most recent Mortgage that was taken out on this home.
Original Mortgage
$451,250
Outstanding Balance
$447,653
Interest Rate
6.72%
Mortgage Type
New Conventional
Estimated Equity
$41,488
Purchase Details
Closed on
Jun 29, 2017
Sold by
Gilchrist Ewen and Gilchrist Jacob Jenelle
Bought by
Scott Andrew and Scott Alexis L
Home Financials for this Owner
Home Financials are based on the most recent Mortgage that was taken out on this home.
Original Mortgage
$321,653
Interest Rate
3.89%
Mortgage Type
New Conventional
Purchase Details
Closed on
Aug 22, 2014
Sold by
Weippert Steven M and Weippert Renelda M
Bought by
Gilchrist Ewen and Gilchrist Jacob Jenelle
Home Financials for this Owner
Home Financials are based on the most recent Mortgage that was taken out on this home.
Original Mortgage
$222,500
Interest Rate
4.1%
Mortgage Type
New Conventional
Create a Home Valuation Report for This Property
The Home Valuation Report is an in-depth analysis detailing your home's value as well as a comparison with similar homes in the area
Home Values in the Area
Average Home Value in this Area
Purchase History
| Date | Buyer | Sale Price | Title Company |
|---|---|---|---|
| Lysne-Burson Desserre | $475,000 | The Title Company | |
| Lysne-Burson Desserre | $475,000 | The Title Company | |
| Scott Andrew | $338,582 | Fm Title | |
| Gilchrist Ewen | -- | None Available |
Source: Public Records
Mortgage History
| Date | Status | Borrower | Loan Amount |
|---|---|---|---|
| Open | Lysne-Burson Desserre | $451,250 | |
| Closed | Lysne-Burson Desserre | $451,250 | |
| Previous Owner | Scott Andrew | $321,653 | |
| Previous Owner | Gilchrist Ewen | $222,500 |
Source: Public Records
Tax History Compared to Growth
Tax History
| Year | Tax Paid | Tax Assessment Tax Assessment Total Assessment is a certain percentage of the fair market value that is determined by local assessors to be the total taxable value of land and additions on the property. | Land | Improvement |
|---|---|---|---|---|
| 2024 | $5,569 | $218,000 | $43,500 | $174,500 |
| 2023 | $5,633 | $203,750 | $43,500 | $160,250 |
| 2022 | $5,266 | $187,000 | $47,500 | $139,500 |
| 2021 | $4,877 | $175,100 | $47,500 | $127,600 |
| 2020 | $4,853 | $175,100 | $47,500 | $127,600 |
| 2019 | $4,604 | $165,450 | $29,700 | $135,750 |
| 2018 | $4,519 | $165,450 | $29,700 | $135,750 |
| 2017 | $4,478 | $165,450 | $29,700 | $135,750 |
| 2016 | $3,864 | $154,850 | $29,700 | $125,150 |
| 2015 | $3,603 | $140,750 | $20,200 | $120,550 |
| 2014 | $3,363 | $127,950 | $20,200 | $107,750 |
| 2013 | $3,269 | $124,200 | $20,200 | $104,000 |
Source: Public Records
Map
Nearby Homes
- 2808 39 1 2 Ave S
- 2808 39 1/2 Ave S
- 2824 39 1 2 Ave S
- 2824 39 1/2 Ave S
- 2802 39 1 2 Ave S
- 2817 39 1 2 Ave S
- 2802 39 1/2 Ave S
- 2832 39 1 2 Ave S
- 2809 39 1 2 Ave S
- 2832 39 1/2 Ave S
- 2817 39 1/2 Ave S
- 2809 39 1/2 Ave S
- 4002 Copperfield Ct S
- 2801 39 1 2 Ave S
- 2801 39 1/2 Ave S
- 7244 28th St SW
- 7236 28th St SW
- 6664 28th St SW
- 2840 39 1/2 Ave S
- 4008 Copperfield Ct S