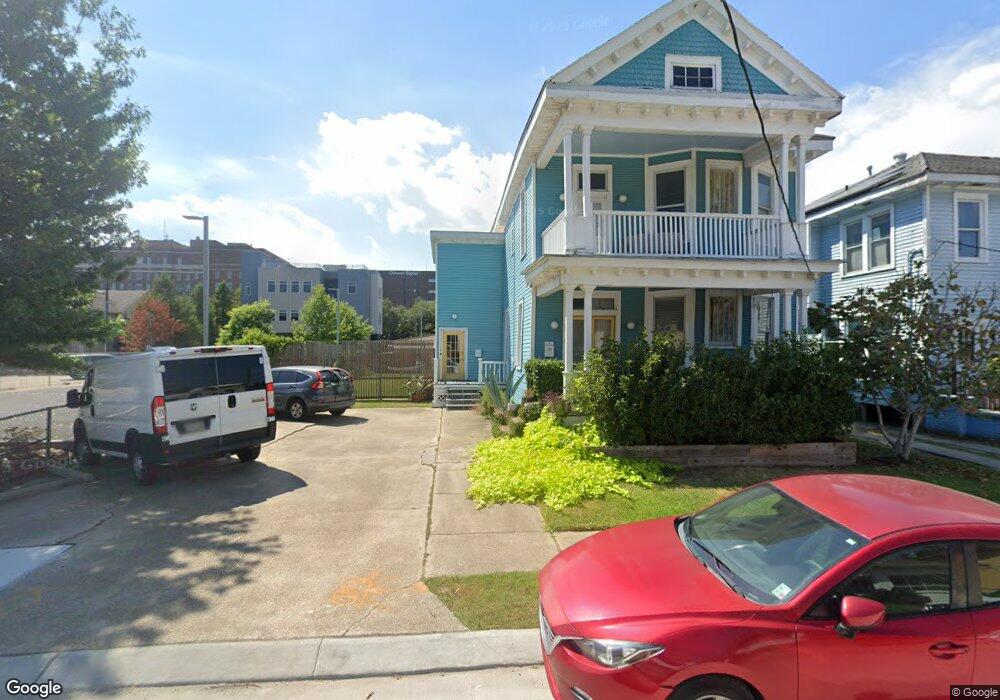
2816 General Pershing St Unit A New Orleans, LA 70115
Milan NeighborhoodEstimated Value: $465,000 - $566,000
3
Beds
2
Baths
1,500
Sq Ft
$350/Sq Ft
Est. Value
About This Home
This home is located at 2816 General Pershing St Unit A, New Orleans, LA 70115 and is currently estimated at $525,053, approximately $350 per square foot. 2816 General Pershing St Unit A is a home located in Orleans Parish with nearby schools including Wilson Charter School, Lawrence D. Crocker College Prep, and Samuel J. Green Charter School.
Ownership History
Date
Name
Owned For
Owner Type
Purchase Details
Closed on
Apr 17, 2017
Sold by
Cupo Sarina Ann and Barrail Juana
Bought by
Barrail Juana and Doria Raul
Current Estimated Value
Purchase Details
Closed on
Sep 7, 2010
Sold by
Gardner Peter B
Bought by
Cupo Sarina Ann
Home Financials for this Owner
Home Financials are based on the most recent Mortgage that was taken out on this home.
Original Mortgage
$291,080
Interest Rate
4.4%
Mortgage Type
FHA
Purchase Details
Closed on
May 23, 2006
Sold by
Gardener Development Llc
Bought by
2816 Gneral Pershing Llc
Purchase Details
Closed on
Mar 15, 2004
Sold by
Restorative Clinics Of Sl
Bought by
Gardner Development L L C
Home Financials for this Owner
Home Financials are based on the most recent Mortgage that was taken out on this home.
Original Mortgage
$500,000
Interest Rate
5.68%
Create a Home Valuation Report for This Property
The Home Valuation Report is an in-depth analysis detailing your home's value as well as a comparison with similar homes in the area
Home Values in the Area
Average Home Value in this Area
Purchase History
| Date | Buyer | Sale Price | Title Company |
|---|---|---|---|
| Barrail Juana | $450,000 | Bayou Title Inc | |
| Cupo Sarina Ann | $295,000 | -- | |
| 2816 Gneral Pershing Llc | $51,000 | -- | |
| Gardner Development L L C | $145,000 | -- |
Source: Public Records
Mortgage History
| Date | Status | Borrower | Loan Amount |
|---|---|---|---|
| Previous Owner | Cupo Sarina Ann | $291,080 | |
| Previous Owner | Gardner Development L L C | $500,000 |
Source: Public Records
Tax History Compared to Growth
Tax History
| Year | Tax Paid | Tax Assessment Tax Assessment Total Assessment is a certain percentage of the fair market value that is determined by local assessors to be the total taxable value of land and additions on the property. | Land | Improvement |
|---|---|---|---|---|
| 2025 | $4,706 | $42,500 | $10,800 | $31,700 |
| 2024 | $4,776 | $42,500 | $10,800 | $31,700 |
| 2023 | $4,486 | $40,500 | $4,320 | $36,180 |
| 2022 | $4,486 | $38,690 | $4,320 | $34,370 |
| 2021 | $4,848 | $40,500 | $4,320 | $36,180 |
| 2020 | $5,888 | $40,500 | $4,320 | $36,180 |
| 2019 | $6,119 | $40,500 | $4,320 | $36,180 |
| 2018 | $6,240 | $40,500 | $4,320 | $36,180 |
| 2017 | $3,170 | $28,510 | $4,320 | $24,190 |
| 2016 | $2,970 | $26,550 | $3,600 | $22,950 |
| 2015 | $2,911 | $26,550 | $3,600 | $22,950 |
| 2014 | -- | $26,550 | $3,600 | $22,950 |
| 2013 | -- | $26,550 | $3,600 | $22,950 |
Source: Public Records
Map
Nearby Homes
- 2813 Milan St
- 2716 20 Milan St
- 2709 Milan St
- 4121 23 Magnolia St
- 4121 Magnolia St
- 4106 08 Magnolia St
- 2715 Marengo St
- 4221 S Robertson St
- 2634 Marengo St
- 2600 General Pershing St
- 3020 22 Gen Taylor St
- 4112 S Derbigny St
- 3721 23 Willow St
- 2605 Napoleon Ave
- 4117 S Robertson St
- 2524 Milan St
- 4236 S Roman St
- 2909 Amelia St
- 2506 General Pershing St
- 3505 Magnolia St
- 2816 General Pershing St
- 2820 General Pershing St
- 2820 22 Gen Pershing St
- 2820 22 General Pershing St
- 2822 General Pershing St
- 2832 General Pershing St
- 4312 Willow St
- 2836 General Pershing St
- 2805 General Pershing St
- 4314 Willow St
- 2815 General Pershing St
- 2801 General Pershing St
- 4628-.5 Clara St
- 0 Clara St
- 434 Clara St
- 5300 Clara St
- 2813 General Pershing St
- 4300 Willow St
- 2817 Napoleon Ave
- 2817 Napoleon Ave Unit 101