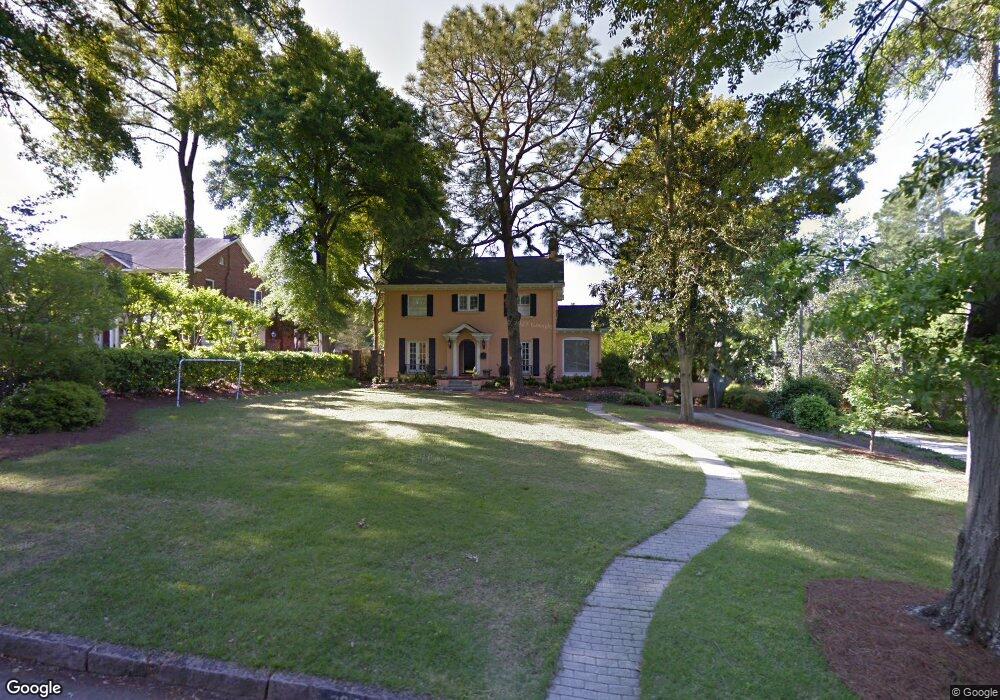
2816 Hillcrest Ave Augusta, GA 30909
Forest Hills NeighborhoodEstimated Value: $759,000 - $922,239
3
Beds
5
Baths
3,833
Sq Ft
$221/Sq Ft
Est. Value
About This Home
This home is located at 2816 Hillcrest Ave, Augusta, GA 30909 and is currently estimated at $846,413, approximately $220 per square foot. 2816 Hillcrest Ave is a home located in Richmond County with nearby schools including Lake Forest Hills Elementary School, Tutt Middle School, and Johnson Magnet.
Ownership History
Date
Name
Owned For
Owner Type
Purchase Details
Closed on
Nov 12, 1999
Sold by
Knox Charles E and Knox Kimberly N
Bought by
Mcleod Kathryn S and Mcleod David G
Current Estimated Value
Purchase Details
Closed on
Aug 8, 1997
Sold by
Eaker James Ronald
Bought by
Knox Ii Charles E
Purchase Details
Closed on
Mar 27, 1992
Sold by
Murray John L
Bought by
Eaker James Ronald
Purchase Details
Closed on
Feb 22, 1991
Sold by
Murray John L
Bought by
Murray Elizabeth D
Purchase Details
Closed on
Jun 6, 1990
Sold by
Walker Harvie A
Bought by
Murray John L
Purchase Details
Closed on
Aug 1, 1986
Sold by
Pruitt Albert W
Bought by
Walker Harvie A
Purchase Details
Closed on
Jul 1, 1982
Purchase Details
Closed on
Mar 1, 1975
Create a Home Valuation Report for This Property
The Home Valuation Report is an in-depth analysis detailing your home's value as well as a comparison with similar homes in the area
Home Values in the Area
Average Home Value in this Area
Purchase History
| Date | Buyer | Sale Price | Title Company |
|---|---|---|---|
| Mcleod Kathryn S | $393,000 | -- | |
| -- | $393,000 | -- | |
| Knox Ii Charles E | $379,900 | -- | |
| Eaker James Ronald | $257,500 | -- | |
| Murray Elizabeth D | -- | -- | |
| Murray John L | $235,000 | -- | |
| Walker Harvie A | $156,000 | -- | |
| -- | $118,900 | -- | |
| -- | $63,900 | -- |
Source: Public Records
Tax History
| Year | Tax Paid | Tax Assessment Tax Assessment Total Assessment is a certain percentage of the fair market value that is determined by local assessors to be the total taxable value of land and additions on the property. | Land | Improvement |
|---|---|---|---|---|
| 2025 | $10,546 | $350,024 | $47,768 | $302,256 |
| 2024 | $10,546 | $329,972 | $47,768 | $282,204 |
| 2023 | $9,825 | $354,692 | $47,768 | $306,924 |
| 2022 | $7,962 | $251,154 | $47,768 | $203,386 |
| 2021 | $7,694 | $221,149 | $47,768 | $173,381 |
| 2020 | $7,462 | $221,498 | $36,000 | $185,498 |
| 2019 | $7,976 | $221,498 | $36,000 | $185,498 |
| 2018 | $8,046 | $221,498 | $36,000 | $185,498 |
| 2017 | $8,002 | $221,498 | $36,000 | $185,498 |
| 2016 | $8,006 | $221,498 | $36,000 | $185,498 |
| 2015 | $8,062 | $221,498 | $36,000 | $185,498 |
| 2014 | $8,070 | $221,498 | $36,000 | $185,498 |
Source: Public Records
Map
Nearby Homes
- 1210 Peachtree Rd
- 2844 Lombardy Ct
- 2904 Lombardy Ct
- 3348 Walton Way
- 1231 Glenn Ave
- 3011 Fox Spring Rd
- 3016 Brems Dr
- 1323 Glenn Ave
- 2716 Hazel St
- 2602 Walton Way
- 1015 Monte Sano Ave
- 2833 Hazel St
- 801 Monte Sano Ave Unit B1
- 801 Monte Sano Ave Unit C4
- 1436 Glenn Ave
- 3030 Walton Way
- 531 Martin Ln
- 2644 Raymond Ave
- 542 Basin St
- 543 Basin St
- 2814 Hillcrest Ave
- 1101 Peachtree Rd
- 1007 Peachtree Rd
- 1130 Peachtree Rd
- 2812 Hillcrest Ave
- 2819 Bellevue Ave
- 2804 Peachtree Place
- 2821 Bellevue Ave
- 2821 Hillcrest Ave
- 2817 Bellevue Ave
- 2803 Peachtree Place
- 1107 Peachtree Rd
- 2817 Hillcrest Ave
- 1105 Peachtree Rd
- 1111 Peachtree Rd
- 2810 Hillcrest Ave
- 2813 Bellevue Ave
- 1001 Peachtree Rd
- 2808 Peachtree Place
- 2815 Hillcrest Ave
Your Personal Tour Guide
Ask me questions while you tour the home.