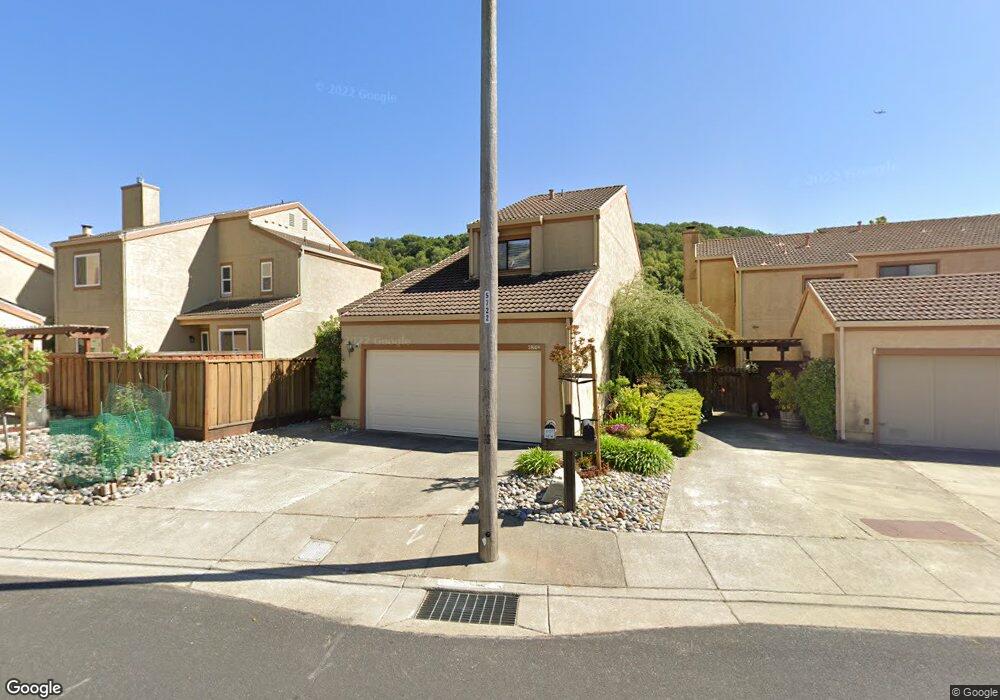
28169 Riggs Ct Hayward, CA 94542
Hayward Highland NeighborhoodEstimated Value: $993,000 - $1,144,000
3
Beds
3
Baths
1,647
Sq Ft
$642/Sq Ft
Est. Value
About This Home
This home is located at 28169 Riggs Ct, Hayward, CA 94542 and is currently estimated at $1,057,648, approximately $642 per square foot. 28169 Riggs Ct is a home located in Alameda County with nearby schools including Stonebrae Elementary School, Bret Harte Middle School, and Hayward High School.
Ownership History
Date
Name
Owned For
Owner Type
Purchase Details
Closed on
Jun 2, 2017
Sold by
Mlynash Benjamin and Shekhtman Michelle Hannah
Bought by
Fukawa Yoshihiro and Fukawa Yasuko
Current Estimated Value
Home Financials for this Owner
Home Financials are based on the most recent Mortgage that was taken out on this home.
Original Mortgage
$556,800
Outstanding Balance
$463,268
Interest Rate
4.03%
Mortgage Type
New Conventional
Estimated Equity
$594,380
Purchase Details
Closed on
Nov 17, 2014
Sold by
Shekhtman Michelle and Mlynash Benjamin
Bought by
Shekhtman Mlynash Family Trust
Home Financials for this Owner
Home Financials are based on the most recent Mortgage that was taken out on this home.
Original Mortgage
$384,000
Interest Rate
4.1%
Mortgage Type
New Conventional
Purchase Details
Closed on
Aug 27, 2012
Sold by
Novella Frank R and Novella Norma J
Bought by
Mylnash Benjamin and Shekhtman Michelle
Home Financials for this Owner
Home Financials are based on the most recent Mortgage that was taken out on this home.
Original Mortgage
$387,845
Interest Rate
3.62%
Mortgage Type
FHA
Create a Home Valuation Report for This Property
The Home Valuation Report is an in-depth analysis detailing your home's value as well as a comparison with similar homes in the area
Home Values in the Area
Average Home Value in this Area
Purchase History
| Date | Buyer | Sale Price | Title Company |
|---|---|---|---|
| Fukawa Yoshihiro | $710,000 | First American Title Company | |
| Shekhtman Mlynash Family Trust | -- | Accommodation | |
| Shekhtman Michelle | -- | Chicago Title Company | |
| Mylnash Benjamin | $395,000 | Old Republic Title Company |
Source: Public Records
Mortgage History
| Date | Status | Borrower | Loan Amount |
|---|---|---|---|
| Open | Fukawa Yoshihiro | $556,800 | |
| Previous Owner | Shekhtman Michelle | $384,000 | |
| Previous Owner | Mylnash Benjamin | $387,845 |
Source: Public Records
Tax History Compared to Growth
Tax History
| Year | Tax Paid | Tax Assessment Tax Assessment Total Assessment is a certain percentage of the fair market value that is determined by local assessors to be the total taxable value of land and additions on the property. | Land | Improvement |
|---|---|---|---|---|
| 2025 | $9,861 | $816,997 | $247,199 | $576,798 |
| 2024 | $9,861 | $800,844 | $242,353 | $565,491 |
| 2023 | $9,712 | $792,004 | $237,601 | $554,403 |
| 2022 | $9,521 | $769,477 | $232,943 | $543,534 |
| 2021 | $9,443 | $754,254 | $228,376 | $532,878 |
| 2020 | $9,336 | $753,451 | $226,035 | $527,416 |
| 2019 | $9,413 | $738,683 | $221,605 | $517,078 |
| 2018 | $8,822 | $724,200 | $217,260 | $506,940 |
| 2017 | $5,284 | $419,106 | $125,732 | $293,374 |
| 2016 | $4,981 | $410,890 | $123,267 | $287,623 |
| 2015 | $4,882 | $404,720 | $121,416 | $283,304 |
| 2014 | $4,639 | $396,792 | $119,037 | $277,755 |
Source: Public Records
Map
Nearby Homes
- 2757 Gamble Ct
- 27956 Edgecliff Way
- 27912 Farm Hill Dr
- 3621 La Mesa Dr
- 27050 Vista Bahia Way
- 0 Parkside Dr
- 0 Hayward Blvd Unit 41103610
- 27449 Dobbel Ave
- 26983 Hayward Blvd
- 26953 Hayward Blvd Unit 105
- 26937 Hayward Blvd Unit 217
- 28828 Bailey Ranch Rd
- 26660 Hayward Blvd
- 26918 Claiborne Ct
- 26550 Hayward Blvd
- 2703 Tribune Ave
- 715 Heath Ct Unit 388
- 806 Maybeck Place
- 680 Dartmore Ln Unit 260
- 685 Dartmore Ln Unit 165
- 28173 Riggs Ct
- 28165 Riggs Ct
- 28161 Riggs Ct
- 28177 Riggs Ct
- 28170 Riggs Ct
- 28157 Riggs Ct
- 28164 Riggs Ct
- 28181 Riggs Ct
- 28160 Riggs Ct
- 28153 Riggs Ct
- 28156 Riggs Ct
- 28163 Dobbel Ave
- 28149 Riggs Ct
- 28148 Riggs Ct
- 28155 Dobbel Ave
- 28171 Dobbel Ave
- 28145 Riggs Ct
- 28147 Dobbel Ave
- 28124 Riggs Ct
- 28128 Riggs Ct