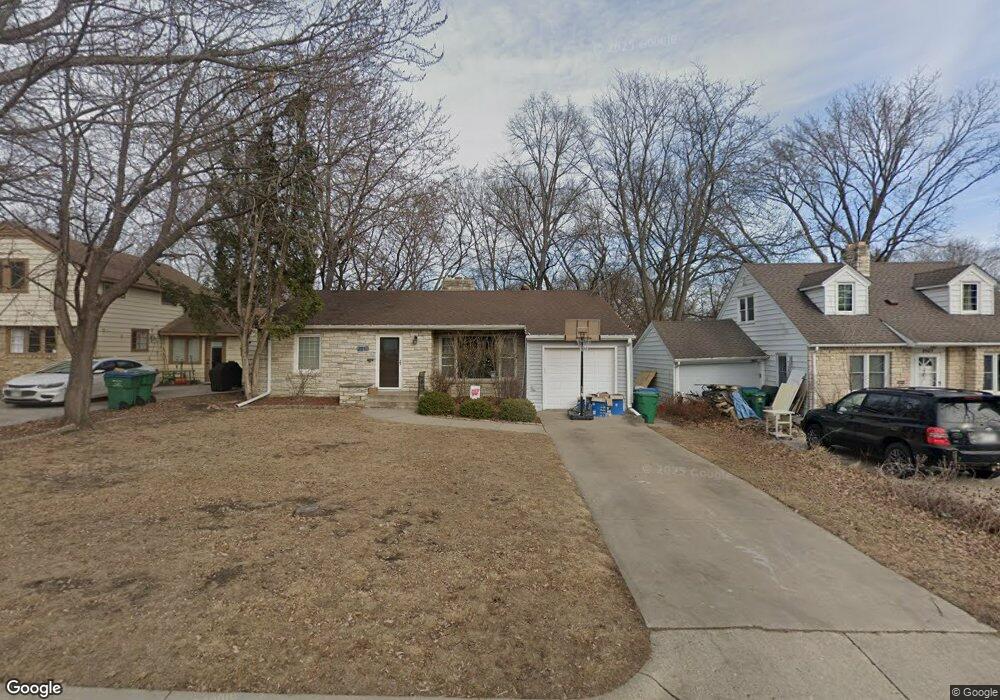
2817 2817 Princeton Ave S St. Louis Park, MN 55416
Fern Hill NeighborhoodEstimated Value: $426,000 - $505,000
3
Beds
2
Baths
1,188
Sq Ft
$392/Sq Ft
Est. Value
About This Home
This home is located at 2817 2817 Princeton Ave S, St. Louis Park, MN 55416 and is currently estimated at $465,254, approximately $391 per square foot. 2817 2817 Princeton Ave S is a home located in Hennepin County with nearby schools including Susan Lindgren Elementary School, St. Louis Park Middle School, and St. Louis Park High School.
Ownership History
Date
Name
Owned For
Owner Type
Purchase Details
Closed on
Apr 17, 2015
Sold by
Redman Heather and Redman Justin
Bought by
Ogren Heather R and Hansa Ogren Paul J
Current Estimated Value
Home Financials for this Owner
Home Financials are based on the most recent Mortgage that was taken out on this home.
Original Mortgage
$276,450
Outstanding Balance
$212,351
Interest Rate
3.68%
Mortgage Type
New Conventional
Estimated Equity
$252,903
Purchase Details
Closed on
Jun 10, 2010
Sold by
Dolan Sean C
Bought by
Hauer Heather
Purchase Details
Closed on
Jun 6, 2003
Sold by
Beth Gina
Bought by
Sean C
Purchase Details
Closed on
Dec 19, 1997
Sold by
Deconcini James E
Bought by
Norman Gina B and White James A
Create a Home Valuation Report for This Property
The Home Valuation Report is an in-depth analysis detailing your home's value as well as a comparison with similar homes in the area
Home Values in the Area
Average Home Value in this Area
Purchase History
| Date | Buyer | Sale Price | Title Company |
|---|---|---|---|
| Ogren Heather R | $291,000 | Titlesmart Inc | |
| Hauer Heather | $272,500 | -- | |
| Sean C | $298,700 | -- | |
| Norman Gina B | $112,000 | -- |
Source: Public Records
Mortgage History
| Date | Status | Borrower | Loan Amount |
|---|---|---|---|
| Open | Ogren Heather R | $276,450 |
Source: Public Records
Tax History Compared to Growth
Tax History
| Year | Tax Paid | Tax Assessment Tax Assessment Total Assessment is a certain percentage of the fair market value that is determined by local assessors to be the total taxable value of land and additions on the property. | Land | Improvement |
|---|---|---|---|---|
| 2024 | $5,450 | $398,000 | $210,700 | $187,300 |
| 2023 | $5,145 | $388,100 | $209,700 | $178,400 |
| 2022 | $4,966 | $398,000 | $199,800 | $198,200 |
| 2021 | $4,587 | $374,000 | $173,800 | $200,200 |
| 2020 | $4,271 | $350,800 | $165,600 | $185,200 |
| 2019 | $4,239 | $316,600 | $164,000 | $152,600 |
| 2018 | $4,117 | $304,400 | $156,200 | $148,200 |
| 2017 | $3,907 | $281,900 | $123,500 | $158,400 |
| 2016 | $3,929 | $274,000 | $116,800 | $157,200 |
| 2015 | $3,925 | $266,400 | $109,200 | $157,200 |
| 2014 | -- | $260,100 | $103,600 | $156,500 |
Source: Public Records
Map
Nearby Homes
- 2936 Monterey Ave S
- 2930 Salem Ave
- 4625 Minnetonka Blvd Unit 105
- 2744 Toledo Ave S
- 3005 Monterey Ave
- 2910 Vernon Ave S
- 2653 Joppa Ave S
- 4100 Sunset Blvd
- 2955 Yosemite Ave S
- 2544 Huntington Ave
- 3201 Xenwood Ave S
- 2656 Xenwood Ave S
- 4013 W 31st St Unit 102
- 2724 Yosemite Ave S
- 2960 Zarthan Ave S
- 2648 Yosemite Ave S
- 2925 Sunset Blvd
- 2833 Alabama Ave S
- 2633 Zarthan Ave S
- 3106 Zarthan Ave S
- 2817 2817 Princeton-Avenue-s
- 2817 Princeton Ave
- 2820 Princeton Ave
- 2826 Princeton Ave
- 2816 Princeton Ave
- 2811 Princeton Ave
- 2823 Princeton Ave
- 2826 Princeton Ave
- 2830 Princeton Ave
- 2829 Princeton Ave
- 4901 W 28th St
- 4815 W 28th St
- 4907 W 28th St
- 2834 Princeton Ave
- 4907 W 28th St
- 2835 Princeton Ave
- 4913 W 28th St
- 4811 W 28th St
- 2840 Princeton Ave
- 4913 W 28th St