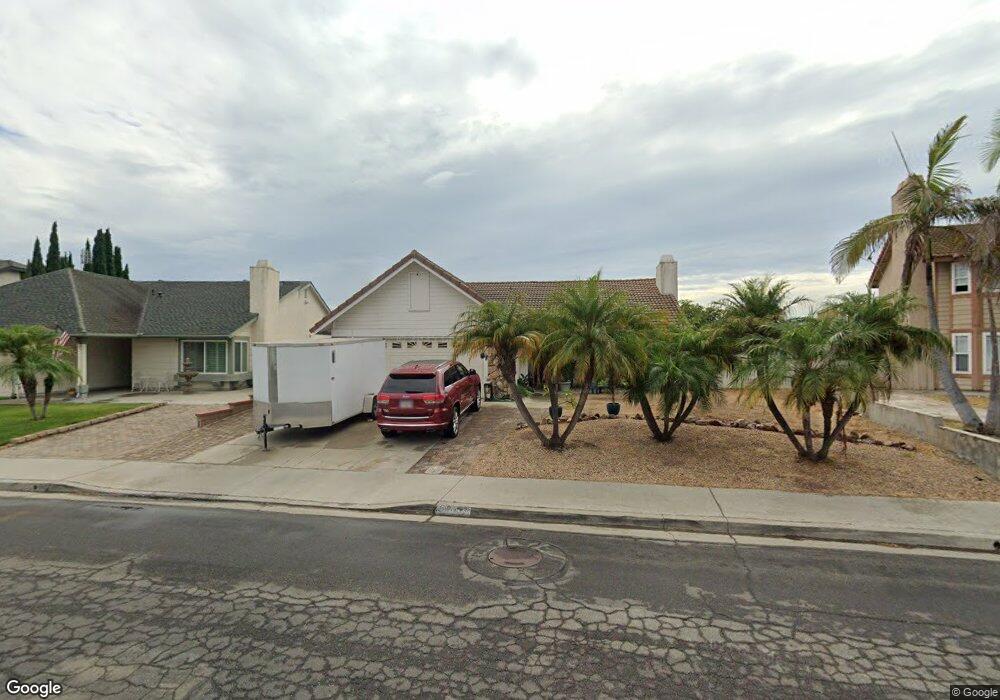
2817 Brandeis Dr Oceanside, CA 92056
Mira Costa NeighborhoodEstimated Value: $913,000 - $995,000
3
Beds
2
Baths
1,423
Sq Ft
$661/Sq Ft
Est. Value
About This Home
This home is located at 2817 Brandeis Dr, Oceanside, CA 92056 and is currently estimated at $940,835, approximately $661 per square foot. 2817 Brandeis Dr is a home located in San Diego County with nearby schools including Christa McAuliffe Elementary School, Martin Luther King Jr. Middle School, and El Camino High School.
Ownership History
Date
Name
Owned For
Owner Type
Purchase Details
Closed on
Oct 30, 2025
Sold by
Sullivan Patricia Ann
Bought by
Patricia A Sullivan Family Trust and Sullivan
Current Estimated Value
Purchase Details
Closed on
Mar 1, 2018
Sold by
Atherton Nancy and Wade Terryl Ann
Bought by
Sullivan Patricia A and Sullivan Eleanor H
Home Financials for this Owner
Home Financials are based on the most recent Mortgage that was taken out on this home.
Original Mortgage
$432,000
Interest Rate
4.22%
Mortgage Type
New Conventional
Purchase Details
Closed on
Apr 18, 2013
Sold by
Atherton Marian P
Bought by
Atherton Marian P
Purchase Details
Closed on
Mar 15, 1996
Sold by
Atherton Hedley P and Atherton Marian P
Bought by
Atherton Hedley P and Atherton Marian P
Home Financials for this Owner
Home Financials are based on the most recent Mortgage that was taken out on this home.
Original Mortgage
$49,700
Interest Rate
7.41%
Mortgage Type
VA
Purchase Details
Closed on
Feb 26, 1987
Create a Home Valuation Report for This Property
The Home Valuation Report is an in-depth analysis detailing your home's value as well as a comparison with similar homes in the area
Home Values in the Area
Average Home Value in this Area
Purchase History
We collect this data history from publicly available records. To have your information removed, we recommend requesting removal directly through your county’s website.
| Date | Buyer | Sale Price | Title Company |
|---|---|---|---|
| Patricia A Sullivan Family Trust | -- | None Listed On Document | |
| Sullivan Patricia A | $540,000 | Corinthian Title Company | |
| Atherton Marian P | -- | First American Title Company | |
| Atherton Hedley P | -- | Old Republic Title Company | |
| -- | $120,400 | -- |
Source: Public Records
Mortgage History
We collect this data history from publicly available records. To have your information removed, we recommend requesting removal directly through your county’s website.
| Date | Status | Borrower | Loan Amount |
|---|---|---|---|
| Previous Owner | Sullivan Patricia A | $432,000 | |
| Previous Owner | Atherton Hedley P | $49,700 |
Source: Public Records
Tax History
| Year | Tax Paid | Tax Assessment Tax Assessment Total Assessment is a certain percentage of the fair market value that is determined by local assessors to be the total taxable value of land and additions on the property. | Land | Improvement |
|---|---|---|---|---|
| 2025 | $8,436 | $750,264 | $531,129 | $219,135 |
| 2024 | $8,276 | $735,554 | $520,715 | $214,839 |
| 2023 | $8,021 | $721,132 | $510,505 | $210,627 |
| 2022 | $6,478 | $578,988 | $385,992 | $192,996 |
| 2021 | $6,504 | $567,636 | $378,424 | $189,212 |
| 2020 | $6,303 | $561,816 | $374,544 | $187,272 |
| 2019 | $6,120 | $550,800 | $367,200 | $183,600 |
| 2018 | $2,267 | $206,481 | $50,290 | $156,191 |
| 2017 | $2,224 | $202,433 | $49,304 | $153,129 |
| 2016 | $2,150 | $198,465 | $48,338 | $150,127 |
| 2015 | $2,088 | $195,484 | $47,612 | $147,872 |
| 2014 | $2,007 | $191,656 | $46,680 | $144,976 |
Source: Public Records
Map
Nearby Homes
- 2858 Lehigh Ct
- 407 Sea Cliff Way
- 3266 San Helena Dr
- 3404 Cameo Dr Unit 2
- 3248 San Helena Dr
- 3511 Cameo Dr Unit 78
- 2194 Luz Way
- 3129 San Helena Dr
- 3355 Genoa Way Unit 127
- 3927 Bedford Ave
- 3607 Frenzel Cir
- 3652 Campus Dr
- 3315 Tripoli Way
- 3319 Tripoli Way
- 3267 Avenida de Loyola
- 2161 Calle Buena Ventura
- 3161 Calle Osuna
- 2801 College Blvd
- 3240 Calle Osuna
- 3648 Seaflower Ln
- 2819 Brandeis Dr
- 2815 Brandeis Dr
- 2821 Brandeis Dr
- 2813 Brandeis Dr
- 2818 Brandeis Dr
- 2814 Brandeis Dr
- 2822 Brandeis Dr
- 2825 Brandeis Dr
- 2811 Brandeis Dr
- 2835 Columbia Dr
- 2810 Brandeis Dr
- 2826 Brandeis Dr
- 2829 Brandeis Dr
- 2809 Brandeis Dr
- 2806 Brandeis Dr
- 2839 Columbia Dr
- 2830 Brandeis Dr
- 2835 Rutgers Place
- 2807 Brandeis Dr
- 2839 Rutgers Place
Your Personal Tour Guide
Ask me questions while you tour the home.