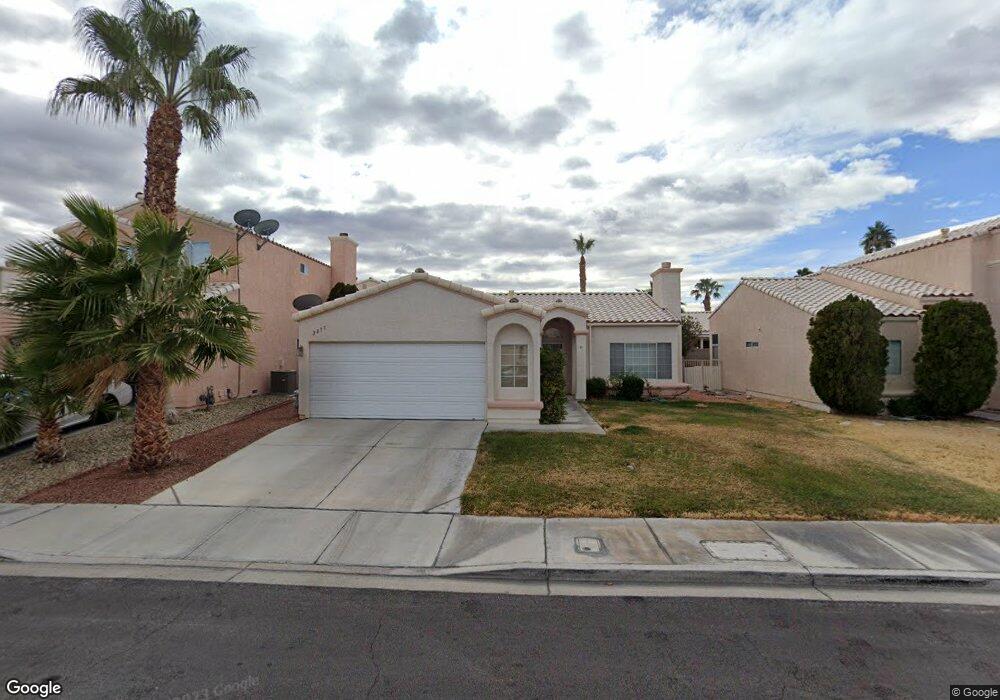
2817 Norfolk Ave Henderson, NV 89074
Green Valley North NeighborhoodEstimated Value: $409,453 - $437,000
3
Beds
2
Baths
1,361
Sq Ft
$310/Sq Ft
Est. Value
About This Home
This home is located at 2817 Norfolk Ave, Henderson, NV 89074 and is currently estimated at $421,613, approximately $309 per square foot. 2817 Norfolk Ave is a home located in Clark County with nearby schools including Aggie Roberts Elementary School, Jack Lund Schofield Middle School, and Silverado High School.
Ownership History
Date
Name
Owned For
Owner Type
Purchase Details
Closed on
Aug 2, 1996
Sold by
Yeomanson John and Yeomanson Victoria
Bought by
Rutter William F and Rutter Willie M
Current Estimated Value
Home Financials for this Owner
Home Financials are based on the most recent Mortgage that was taken out on this home.
Original Mortgage
$93,550
Outstanding Balance
$7,375
Interest Rate
8.18%
Estimated Equity
$414,238
Create a Home Valuation Report for This Property
The Home Valuation Report is an in-depth analysis detailing your home's value as well as a comparison with similar homes in the area
Home Values in the Area
Average Home Value in this Area
Purchase History
| Date | Buyer | Sale Price | Title Company |
|---|---|---|---|
| Rutter William F | $117,000 | Old Republic Title Company |
Source: Public Records
Mortgage History
| Date | Status | Borrower | Loan Amount |
|---|---|---|---|
| Open | Rutter William F | $93,550 |
Source: Public Records
Tax History Compared to Growth
Tax History
| Year | Tax Paid | Tax Assessment Tax Assessment Total Assessment is a certain percentage of the fair market value that is determined by local assessors to be the total taxable value of land and additions on the property. | Land | Improvement |
|---|---|---|---|---|
| 2025 | $1,477 | $79,325 | $35,175 | $44,150 |
| 2024 | $1,434 | $79,325 | $35,175 | $44,150 |
| 2023 | $1,434 | $75,269 | $32,900 | $42,369 |
| 2022 | $1,392 | $66,221 | $27,300 | $38,921 |
| 2021 | $1,352 | $62,790 | $25,550 | $37,240 |
| 2020 | $1,310 | $61,311 | $24,150 | $37,161 |
| 2019 | $1,271 | $58,166 | $21,350 | $36,816 |
| 2018 | $1,234 | $54,868 | $19,250 | $35,618 |
| 2017 | $1,538 | $53,028 | $16,800 | $36,228 |
| 2016 | $1,170 | $48,834 | $12,250 | $36,584 |
| 2015 | $1,167 | $46,417 | $10,150 | $36,267 |
| 2014 | $1,133 | $39,197 | $8,750 | $30,447 |
Source: Public Records
Map
Nearby Homes
- 2824 Mayfair Ave
- 216 Highgate St
- 240 Highgate St
- 2761 Carnation Ln
- 2766 Chokecherry Ave
- 2755 Carnation Ln Unit 4
- 259 Bonnie Claire Ct
- 2816 Via Florentine St
- 2881 Violet Ln Unit 2881
- 2842 Via Florentine St
- 2901 Sarina Ave
- 264 Via Contata St
- 2526 Begonia Valley Ave
- 2704 Coventry Green Ave
- 2850 Nikki Place
- 258 Finestra Dr
- 2854 Mahogany Grove Ave
- 2838 Via Stella St
- 2975 Bluegrass Ln Unit 1111
- 2975 Bluegrass Ln Unit 1421
- 2819 Norfolk Ave Unit 2
- 2815 Norfolk Ave
- 2816 Yorkshire Ave
- 2813 Norfolk Ave
- 2821 Norfolk Ave
- 2814 Yorkshire Ave
- 2818 Yorkshire Ave Unit 2
- 2820 Yorkshire Ave
- 2812 Yorkshire Ave
- 2816 Norfolk Ave
- 2823 Norfolk Ave
- 2818 Norfolk Ave
- 2811 Norfolk Ave
- 2814 Norfolk Ave
- 2820 Norfolk Ave
- 2822 Yorkshire Ave
- 2810 Yorkshire Ave Unit 2
- 2812 Norfolk Ave
- 2809 Norfolk Ave Unit 2
- 2825 Norfolk Ave