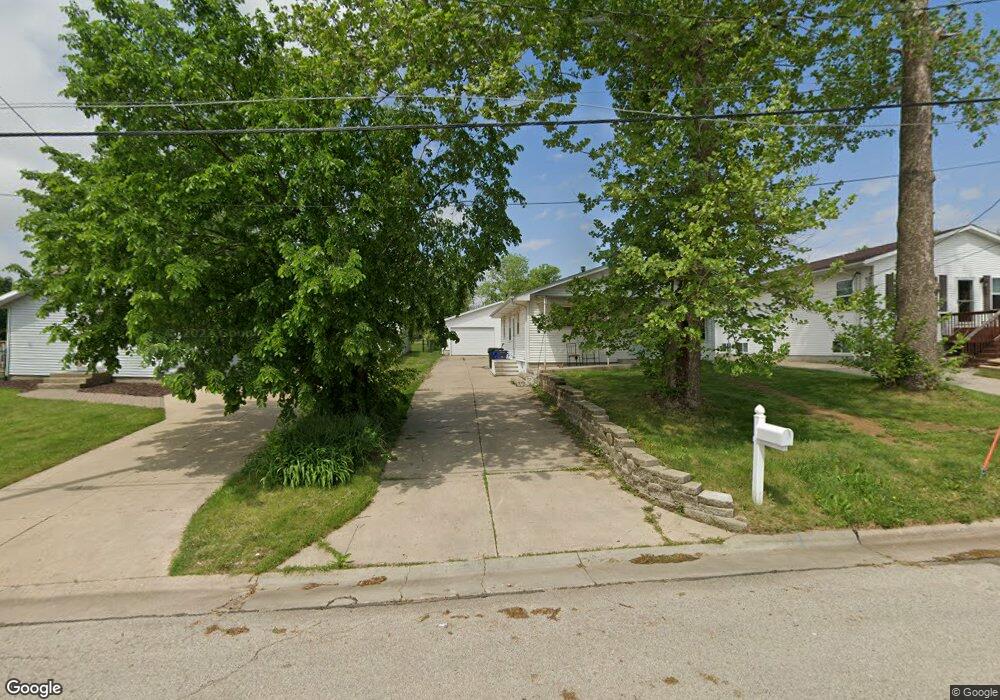
2818 Fruitland Blvd SW Cedar Rapids, IA 52404
Southwest Area NeighborhoodEstimated Value: $155,000 - $175,284
3
Beds
1
Bath
936
Sq Ft
$174/Sq Ft
Est. Value
About This Home
This home is located at 2818 Fruitland Blvd SW, Cedar Rapids, IA 52404 and is currently estimated at $163,071, approximately $174 per square foot. 2818 Fruitland Blvd SW is a home located in Linn County with nearby schools including Junction City Elementary School, Grant Elementary School, and Bruce Hall Day Treatment Center.
Ownership History
Date
Name
Owned For
Owner Type
Purchase Details
Closed on
Aug 18, 2023
Sold by
Burkhart Douglas E and Burkhart Lori M
Bought by
Schnepp Cade M
Current Estimated Value
Home Financials for this Owner
Home Financials are based on the most recent Mortgage that was taken out on this home.
Original Mortgage
$142,000
Outstanding Balance
$138,854
Interest Rate
6.96%
Mortgage Type
New Conventional
Estimated Equity
$24,217
Purchase Details
Closed on
Oct 23, 2018
Sold by
The Estate Of Kimberly A Tannehill
Bought by
Burkhart Douglas E and Burkhart Lori M
Purchase Details
Closed on
Mar 11, 2011
Sold by
Burkhart Harold E and Burkhart Patricia A
Bought by
Tannehill Kimberly and Tannehill Kim
Purchase Details
Closed on
Jun 14, 2007
Sold by
Burkhart Harold and Burkhart Patricia
Bought by
Tannehill Kim
Create a Home Valuation Report for This Property
The Home Valuation Report is an in-depth analysis detailing your home's value as well as a comparison with similar homes in the area
Home Values in the Area
Average Home Value in this Area
Purchase History
| Date | Buyer | Sale Price | Title Company |
|---|---|---|---|
| Schnepp Cade M | $148,000 | None Listed On Document | |
| Burkhart Douglas E | $40,000 | None Available | |
| Tannehill Kimberly | -- | None Available | |
| Tannehill Kim | -- | None Available |
Source: Public Records
Mortgage History
| Date | Status | Borrower | Loan Amount |
|---|---|---|---|
| Open | Schnepp Cade M | $142,000 |
Source: Public Records
Tax History Compared to Growth
Tax History
| Year | Tax Paid | Tax Assessment Tax Assessment Total Assessment is a certain percentage of the fair market value that is determined by local assessors to be the total taxable value of land and additions on the property. | Land | Improvement |
|---|---|---|---|---|
| 2025 | $2,492 | $165,000 | $31,200 | $133,800 |
| 2024 | $2,888 | $148,100 | $25,300 | $122,800 |
| 2023 | $2,888 | $140,800 | $25,300 | $115,500 |
| 2022 | $2,746 | $136,900 | $25,300 | $111,600 |
| 2021 | $2,642 | $132,600 | $25,300 | $107,300 |
| 2020 | $2,642 | $119,700 | $20,800 | $98,900 |
| 2019 | $2,392 | $119,500 | $17,900 | $101,600 |
| 2018 | $2,322 | $119,500 | $17,900 | $101,600 |
| 2017 | $2,352 | $116,500 | $17,900 | $98,600 |
| 2016 | $2,517 | $118,400 | $17,900 | $100,500 |
| 2015 | $2,425 | $114,009 | $17,850 | $96,159 |
| 2014 | $2,240 | $114,009 | $17,850 | $96,159 |
| 2013 | $2,188 | $114,009 | $17,850 | $96,159 |
Source: Public Records
Map
Nearby Homes
- 2955 Bowling St SW Unit E238
- 51 29th Avenue Dr SW Unit D11
- 51 29th Avenue Dr SW Unit C22
- 42 Park Village Ave SW
- 2601 Teresa Dr SW
- 3010 Bowling St SW
- 2321 Lauren Dr SW
- 2937 Southland St SW
- 2818 Southland St SW
- 9 33rd Ave SW
- 2212 Deborah Dr SW
- 3212 Southland St SW
- 2401 Victoria Dr SW
- 90 29th Ave SW
- Lot A-D 41st Avenue Dr SW
- 148 33rd Ave SW
- 2021 Hamilton St SW
- 186 22nd Ave SW
- 0 Rompot St SE
- 1756 Mallory St SW
- 2820 Fruitland Blvd SW
- 2812 Fruitland Blvd SW
- 2817 Fruitland Blvd SW
- 2819 Fruitland Blvd SW
- 2806 Fruitland Blvd SW
- 2813 Fruitland Blvd SW
- 2807 Fruitland Blvd SW
- 2801 Fruitland Blvd SW
- 2696 Fruitland Blvd SW
- 2699 Fruitland Blvd SW
- 2693 Fruitland Blvd SW
- 2687 Fruitland Blvd SW
- 2674 Fruitland Blvd SW
- 2681 Fruitland Blvd SW
- 2672 Fruitland Blvd SW
- 2673 Fruitland Blvd SW
- 2666 Fruitland Blvd SW
- 2667 Fruitland Blvd SW
- 2662 Fruitland Blvd SW
- 2663 Fruitland Blvd SW