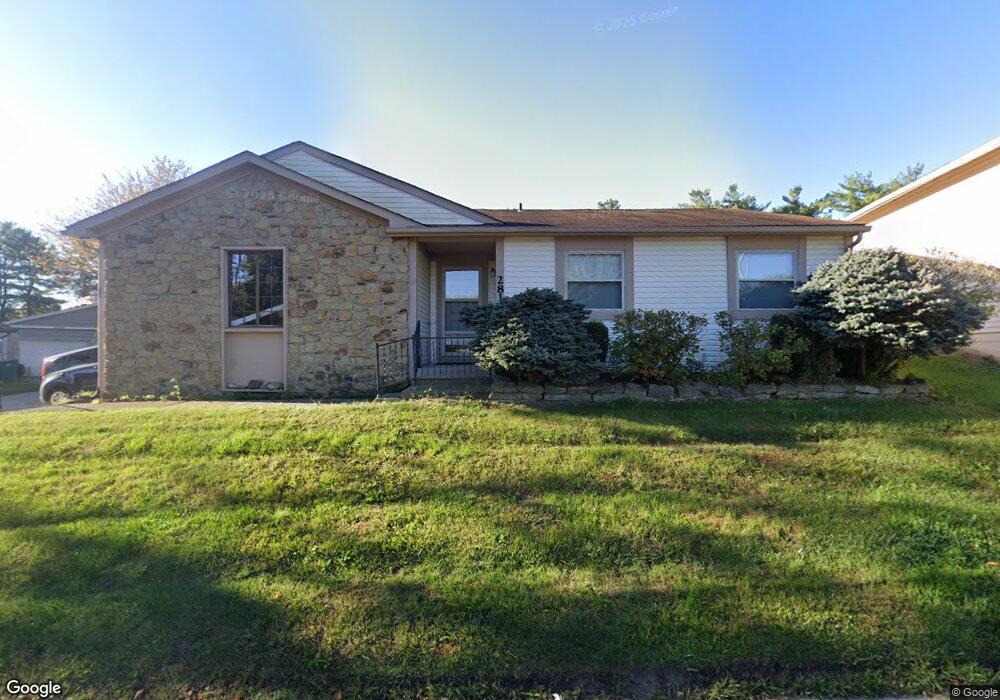
2818 Saddle Barn West Dr Indianapolis, IN 46214
Key Meadows NeighborhoodEstimated Value: $184,000 - $193,416
2
Beds
--
Bath
1,349
Sq Ft
$141/Sq Ft
Est. Value
About This Home
This home is located at 2818 Saddle Barn West Dr, Indianapolis, IN 46214 and is currently estimated at $190,104, approximately $140 per square foot. 2818 Saddle Barn West Dr is a home located in Marion County with nearby schools including North Wayne Elementary School, Chapel Hill 7th & 8th Grade Center, and Ben Davis Ninth Grade Center.
Ownership History
Date
Name
Owned For
Owner Type
Purchase Details
Closed on
Aug 7, 2023
Sold by
Ivy Properties Llc
Bought by
Kendrick Tammy
Current Estimated Value
Home Financials for this Owner
Home Financials are based on the most recent Mortgage that was taken out on this home.
Original Mortgage
$179,450
Outstanding Balance
$175,474
Interest Rate
6.96%
Mortgage Type
New Conventional
Estimated Equity
$14,630
Purchase Details
Closed on
Apr 21, 2023
Sold by
Sheriff Of Marion County
Bought by
Ivy Properties Llc and Eagle Valley Farms Homeowners Association Inc
Purchase Details
Closed on
Mar 29, 2017
Sold by
Henricks Mary Ann
Bought by
Walsh Kathleen M
Home Financials for this Owner
Home Financials are based on the most recent Mortgage that was taken out on this home.
Original Mortgage
$68,000
Interest Rate
4.1%
Mortgage Type
New Conventional
Create a Home Valuation Report for This Property
The Home Valuation Report is an in-depth analysis detailing your home's value as well as a comparison with similar homes in the area
Home Values in the Area
Average Home Value in this Area
Purchase History
| Date | Buyer | Sale Price | Title Company |
|---|---|---|---|
| Kendrick Tammy | -- | First American Title | |
| Ivy Properties Llc | $117,000 | None Listed On Document | |
| Walsh Kathleen M | $85,000 | -- | |
| Walsh Kathleen M | $85,000 | Chicago Title |
Source: Public Records
Mortgage History
| Date | Status | Borrower | Loan Amount |
|---|---|---|---|
| Open | Kendrick Tammy | $179,450 | |
| Previous Owner | Walsh Kathleen M | $68,000 |
Source: Public Records
Tax History Compared to Growth
Tax History
| Year | Tax Paid | Tax Assessment Tax Assessment Total Assessment is a certain percentage of the fair market value that is determined by local assessors to be the total taxable value of land and additions on the property. | Land | Improvement |
|---|---|---|---|---|
| 2024 | $1,872 | $169,500 | $13,800 | $155,700 |
| 2023 | $1,872 | $154,300 | $13,800 | $140,500 |
| 2022 | $1,792 | $146,700 | $13,800 | $132,900 |
| 2021 | $1,447 | $108,000 | $13,800 | $94,200 |
| 2020 | $1,257 | $95,100 | $13,800 | $81,300 |
| 2019 | $1,100 | $85,100 | $13,800 | $71,300 |
| 2018 | $805 | $77,200 | $13,800 | $63,400 |
| 2017 | $279 | $76,000 | $13,800 | $62,200 |
| 2016 | $299 | $76,800 | $13,800 | $63,000 |
| 2014 | $652 | $78,000 | $13,800 | $64,200 |
| 2013 | $862 | $75,400 | $13,800 | $61,600 |
Source: Public Records
Map
Nearby Homes
- 2807 Saddle Barn Dr E
- 3213 Oceanline Dr E
- 3266 Oceanline East Dr
- 3276 Eddy Ct
- 7529 Oceanline Dr
- 3104 Valley Farms Rd
- 8024 Sunfield Ct Unit 5-B
- 7848 Inishmore Way
- 2463 Kettering Way
- 3131 Stillmeadow Dr
- 7962 Valley Farms Ct
- 8001 Valley Farms Ln
- 3429 Maritime Dr
- 2249 Rolling Oak Dr
- 3335 Oceanline Dr
- 3411 Oceanline Dr
- 6937 Mapleton Ct
- 8317 Pine Branch Ln
- 8333 Pine Branch Ln
- 6935 Deerbrook Ct
- 2818 Saddle Barn Dr W
- 2820 Saddle Barn West Dr
- 2820 Saddle Barn Dr W
- 2814 Saddle Barn West Dr
- 2820 Saddle Barn West Dr
- 2814 Saddle Barn Dr W Unit 10
- 2814 Saddle Barn Dr W
- 2814 Saddle Barn Wd
- 2822 Saddle Barn Unit 11
- 2822 Saddle Barn
- 2822 Saddle Barn West Dr
- 2810 Saddle Barn West Dr
- 2810 W Saddle Barn Dr
- 2810 Saddle Barn Dr W
- 2802 Saddle Barn Dr W
- 2802 Saddle Barn West Dr
- 2806 Saddle Barn West Dr
- 2809 Saddle Barn West Dr
- 2824 Saddle Barn Dr W
- 2824 Saddle Barn West Dr