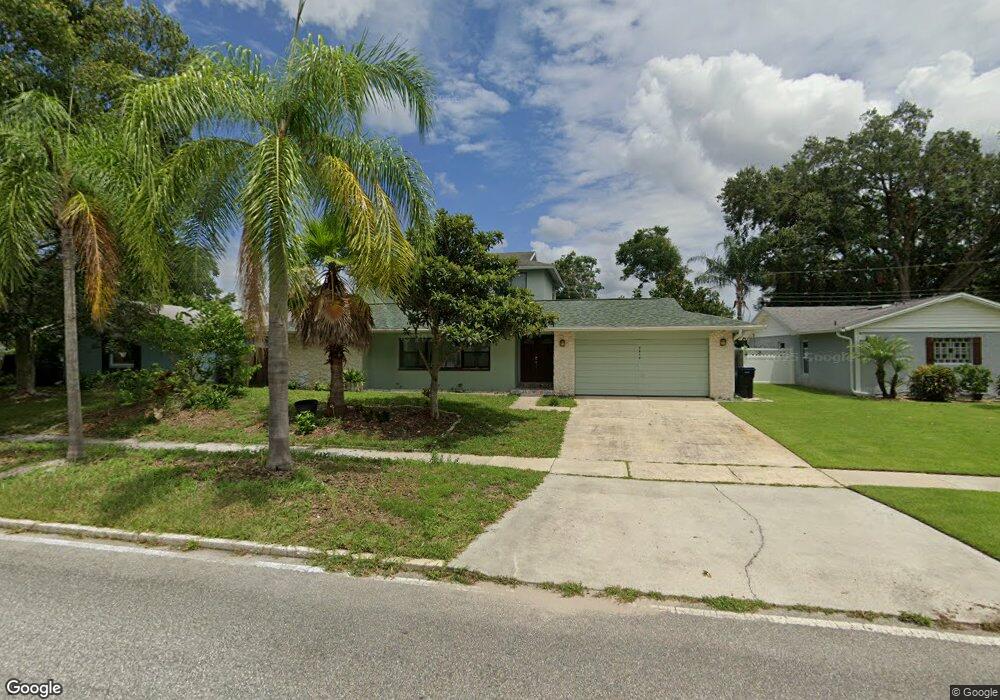
2819 Banchory Rd Unit 6 Winter Park, FL 32792
Estimated Value: $637,000 - $715,000
4
Beds
4
Baths
2,856
Sq Ft
$242/Sq Ft
Est. Value
About This Home
This home is located at 2819 Banchory Rd Unit 6, Winter Park, FL 32792 and is currently estimated at $690,631, approximately $241 per square foot. 2819 Banchory Rd Unit 6 is a home located in Orange County with nearby schools including Aloma Elementary School, Glenridge Middle, and Winter Park High.
Ownership History
Date
Name
Owned For
Owner Type
Purchase Details
Closed on
Jul 31, 2019
Sold by
Du Balak Banjamin and Du Lys Charlotte Marie Tinquet
Bought by
Perkins Dw Phineas
Current Estimated Value
Home Financials for this Owner
Home Financials are based on the most recent Mortgage that was taken out on this home.
Original Mortgage
$363,300
Outstanding Balance
$240,281
Interest Rate
3.8%
Mortgage Type
New Conventional
Estimated Equity
$450,350
Purchase Details
Closed on
Nov 20, 2002
Sold by
Ziff David
Bought by
Balak Benjamin and Trinquet Anne C
Purchase Details
Closed on
May 23, 2002
Sold by
Edward H Reynolds M and Evelyn L Reynolds M
Bought by
Ziff David
Home Financials for this Owner
Home Financials are based on the most recent Mortgage that was taken out on this home.
Original Mortgage
$150,100
Interest Rate
6.98%
Mortgage Type
New Conventional
Create a Home Valuation Report for This Property
The Home Valuation Report is an in-depth analysis detailing your home's value as well as a comparison with similar homes in the area
Home Values in the Area
Average Home Value in this Area
Purchase History
| Date | Buyer | Sale Price | Title Company |
|---|---|---|---|
| Perkins Dw Phineas | $519,000 | Brokers Title Of Ctrl Fl Llc | |
| Balak Benjamin | $182,000 | -- | |
| Ziff David | $158,000 | -- |
Source: Public Records
Mortgage History
| Date | Status | Borrower | Loan Amount |
|---|---|---|---|
| Open | Perkins Dw Phineas | $363,300 | |
| Previous Owner | Ziff David | $150,100 |
Source: Public Records
Tax History Compared to Growth
Tax History
| Year | Tax Paid | Tax Assessment Tax Assessment Total Assessment is a certain percentage of the fair market value that is determined by local assessors to be the total taxable value of land and additions on the property. | Land | Improvement |
|---|---|---|---|---|
| 2025 | $9,069 | $597,270 | $270,000 | $327,270 |
| 2024 | $8,448 | $582,450 | $270,000 | $312,450 |
| 2023 | $8,448 | $564,234 | $270,000 | $294,234 |
| 2022 | $5,906 | $400,882 | $0 | $0 |
| 2021 | $5,816 | $389,206 | $0 | $0 |
| 2020 | $5,541 | $383,832 | $0 | $0 |
| 2019 | $3,399 | $232,492 | $0 | $0 |
| 2018 | $3,370 | $228,157 | $0 | $0 |
| 2017 | $3,316 | $319,177 | $145,000 | $174,177 |
| 2016 | $3,288 | $287,916 | $130,000 | $157,916 |
| 2015 | $3,342 | $285,366 | $90,000 | $195,366 |
| 2014 | $3,396 | $242,982 | $75,000 | $167,982 |
Source: Public Records
Map
Nearby Homes
- 2774 Banchory Rd
- 2758 Banchory Rd
- 346 S Ranger Blvd
- 2860 Sheriff Way
- 2948 Antique Oaks Cir Unit 94
- 2758 Sandwell Dr
- 638 Warrenton Rd
- 3038 Antique Oaks Cir Unit 166
- 3019 Antique Oaks Cir Unit 124
- 631 Warrenton Rd
- 2485 Middleton Ave
- 2923 Antique Oaks Cir Unit 39
- 2923 Antique Oaks Cir Unit 37
- 2418 Whitehall Cir
- 2905 Antique Oaks Cir Unit 6
- 2478 Whitehall Cir
- 2421 Summerfield Rd
- 607 Saint Johns Ct Unit 607
- 2831 Lion Heart Rd
- 2708 Lion Heart Rd
- 2819 Banchory Rd
- 2827 Banchory Rd
- 2811 Banchory Rd
- 2826 Fitzooth Dr
- 2818 Fitzooth Dr
- 2835 Banchory Rd
- 2803 Banchory Rd
- 2834 Fitzooth Dr
- 2820 Banchory Rd
- 2810 Fitzooth Dr
- 2828 Banchory Rd
- 2812 Banchory Rd
- 2836 Banchory Rd
- 2843 Banchory Rd
- 2781 Banchory Rd
- 2804 Banchory Rd
- 2825 Fitzooth Dr
- 2825 Fitzooth Dr Unit 6
- 546 Friar Rd
- 2813 Little John Rd