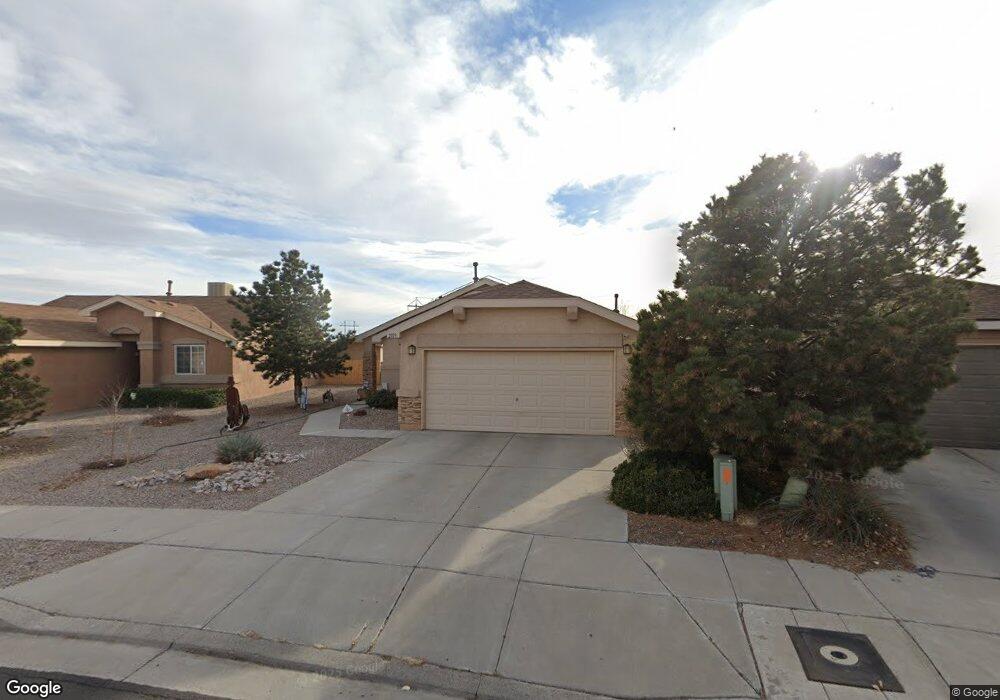
2819 Butch Cassidy Dr SW Albuquerque, NM 87121
Southwest Heights NeighborhoodEstimated Value: $267,000 - $286,000
3
Beds
2
Baths
1,420
Sq Ft
$194/Sq Ft
Est. Value
About This Home
This home is located at 2819 Butch Cassidy Dr SW, Albuquerque, NM 87121 and is currently estimated at $276,016, approximately $194 per square foot. 2819 Butch Cassidy Dr SW is a home located in Bernalillo County with nearby schools including Rudolfo Anaya Elementary School, Tony Hillerman Middle School, and Atrisco Heritage Academy High School.
Ownership History
Date
Name
Owned For
Owner Type
Purchase Details
Closed on
May 24, 2021
Sold by
Mcclelen Floyd and Mcclelen Sue J
Bought by
Mcclelen Floyd and Mcclelen Karla S
Current Estimated Value
Home Financials for this Owner
Home Financials are based on the most recent Mortgage that was taken out on this home.
Original Mortgage
$140,000
Outstanding Balance
$126,476
Interest Rate
2.9%
Mortgage Type
New Conventional
Estimated Equity
$149,540
Purchase Details
Closed on
Aug 23, 2010
Sold by
Sterling William A
Bought by
Jenkins Keri and Chandler Jason
Purchase Details
Closed on
Sep 28, 2004
Sold by
Pulte Homes Of New Mexico Inc
Bought by
Mcclelen Floyd and Mcclelen Sue J
Home Financials for this Owner
Home Financials are based on the most recent Mortgage that was taken out on this home.
Original Mortgage
$110,687
Interest Rate
5.81%
Mortgage Type
FHA
Create a Home Valuation Report for This Property
The Home Valuation Report is an in-depth analysis detailing your home's value as well as a comparison with similar homes in the area
Home Values in the Area
Average Home Value in this Area
Purchase History
| Date | Buyer | Sale Price | Title Company |
|---|---|---|---|
| Mcclelen Floyd | -- | Priority Title & Escrow | |
| Jenkins Keri | -- | None Available | |
| Mcclelen Floyd | -- | Albuquerque Title Co Inc |
Source: Public Records
Mortgage History
| Date | Status | Borrower | Loan Amount |
|---|---|---|---|
| Open | Mcclelen Floyd | $140,000 | |
| Previous Owner | Mcclelen Floyd | $110,687 |
Source: Public Records
Tax History Compared to Growth
Tax History
| Year | Tax Paid | Tax Assessment Tax Assessment Total Assessment is a certain percentage of the fair market value that is determined by local assessors to be the total taxable value of land and additions on the property. | Land | Improvement |
|---|---|---|---|---|
| 2024 | $1,785 | $44,311 | $12,784 | $31,527 |
| 2023 | $1,753 | $43,021 | $12,412 | $30,609 |
| 2022 | $1,691 | $41,768 | $12,050 | $29,718 |
| 2021 | $1,632 | $40,551 | $11,699 | $28,852 |
| 2020 | $1,603 | $39,371 | $11,359 | $28,012 |
| 2019 | $1,553 | $38,225 | $11,028 | $27,197 |
| 2018 | $1,496 | $38,225 | $11,028 | $27,197 |
| 2017 | $1,447 | $37,112 | $10,707 | $26,405 |
| 2016 | $1,403 | $34,982 | $10,093 | $24,889 |
| 2015 | $33,963 | $33,963 | $9,799 | $24,164 |
| 2014 | $1,354 | $33,897 | $9,799 | $24,098 |
| 2013 | -- | $34,197 | $9,799 | $24,398 |
Source: Public Records
Map
Nearby Homes
- 2771 Butch Cassidy Dr SW
- 8524 Stony Creek Rd SW
- 4301 Blake Trailer 40 Rd SW
- 9801 Sun Chaser Trail SW Unit 1
- 9808 Morning Sun Trail SW
- 8909 Indigo Sky Trail SW
- 3201 Mata Ortiz Dr SW
- 8912 Indigo Sky Trail SW
- 9201 Upper Meadow Ave SW
- 9901 Morning Sun Trail SW
- 9101 Indigo Sky Trail SW
- 9215 Daisy Summer Ave SW
- 9028 Indigo Sky Trail SW
- 9909 Shiraz Rd SW
- 9000 Violet Orchid Trail SW
- 9909 Saddlehorn Trail SW
- 2503 Sancho Panza Way SW
- 2627 Sun Canyon Ln SW
- 2724 Barcelona Place SW
- 8928 Lower Meadow Trail SW
- 2823 Butch Cassidy Dr SW
- 2815 Butch Cassidy Dr SW
- 2827 Butch Cassidy Dr SW
- 2809 Butch Cassidy Dr SW
- 2831 Butch Cassidy Dr SW
- 2805 Butch Cassidy Dr SW
- 2816 Butch Cassidy Dr SW
- 2824 Butch Cassidy Dr SW
- 2835 Butch Cassidy Dr SW
- 2828 Butch Cassidy Dr SW
- 2800 Butch Cassidy Dr SW
- 2801 Butch Cassidy Dr SW
- 2832 Butch Cassidy Dr SW
- 2839 Butch Cassidy Dr SW
- 2783 Butch Cassidy Dr SW
- 2784 Butch Cassidy Dr SW
- 2843 Butch Cassidy Dr SW
- 2815 Sundance Kid Dr SW
- 2836 Butch Cassidy Dr SW
- 2827 Sundance Kid Dr SW