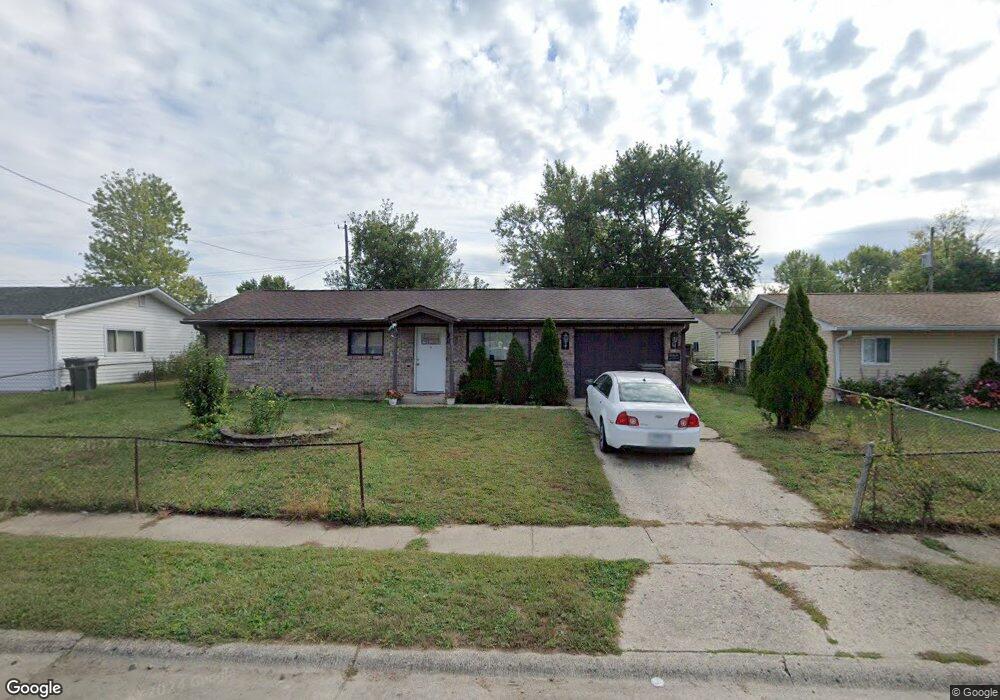
2819 Dawson St Indianapolis, IN 46203
Near Southeast NeighborhoodEstimated Value: $90,000 - $170,000
4
Beds
2
Baths
1,008
Sq Ft
$140/Sq Ft
Est. Value
About This Home
This home is located at 2819 Dawson St, Indianapolis, IN 46203 and is currently estimated at $140,799, approximately $139 per square foot. 2819 Dawson St is a home located in Marion County with nearby schools including Eleanor Skillen School No. 34, Ralph Waldo Emerson School 58, and James A. Garfield School 31.
Ownership History
Date
Name
Owned For
Owner Type
Purchase Details
Closed on
Apr 18, 2021
Sold by
Murillo Hugo
Bought by
Murillo Real Estate S Corp
Current Estimated Value
Purchase Details
Closed on
Feb 18, 2021
Sold by
Murillo Hugo
Bought by
Murillo Real Estate S Corp
Purchase Details
Closed on
May 31, 2018
Sold by
Hud
Bought by
Midfirst Bank
Purchase Details
Closed on
May 2, 2018
Bought by
Hugo Murillo
Purchase Details
Closed on
May 1, 2018
Purchase Details
Closed on
Apr 22, 2018
Sold by
Midfirst Bank
Bought by
Hud
Purchase Details
Closed on
Jun 19, 2015
Sold by
Orta Sabino
Bought by
Midfirst Bank
Create a Home Valuation Report for This Property
The Home Valuation Report is an in-depth analysis detailing your home's value as well as a comparison with similar homes in the area
Home Values in the Area
Average Home Value in this Area
Purchase History
| Date | Buyer | Sale Price | Title Company |
|---|---|---|---|
| Murillo Real Estate S Corp | -- | None Available | |
| Murillo Real Estate S Corp | -- | None Available | |
| Midfirst Bank | -- | None Available | |
| Hugo Murillo | $22,000 | -- | |
| Murillo Hugo | $22,000 | Monument Title Insurance Compa | |
| Murillo Hugo | $22,000 | Monument Title Insurance Compa | |
| -- | $14,900 | -- | |
| 317 Realty Group Llc | $3,200 | Monument Title Insurance Compa | |
| Indy Investments Llc | $3,200 | Monument Title Insurance Compa | |
| 317 Realty Group Llc | $3,200 | Monument Title Insurance Compa | |
| Indy Investments Llc | $3,200 | Monument Title Insurance Compa | |
| Hud | -- | None Available | |
| Midfirst Bank | $69,410 | Attorney |
Source: Public Records
Tax History Compared to Growth
Tax History
| Year | Tax Paid | Tax Assessment Tax Assessment Total Assessment is a certain percentage of the fair market value that is determined by local assessors to be the total taxable value of land and additions on the property. | Land | Improvement |
|---|---|---|---|---|
| 2024 | $920 | $31,600 | $11,400 | $20,200 |
| 2023 | $920 | $32,400 | $11,400 | $21,000 |
| 2022 | $935 | $33,100 | $11,400 | $21,700 |
| 2021 | $733 | $25,200 | $11,400 | $13,800 |
| 2020 | $697 | $23,900 | $11,400 | $12,500 |
| 2019 | $534 | $18,500 | $5,400 | $13,100 |
| 2018 | $2,187 | $85,700 | $5,400 | $80,300 |
| 2017 | $1,896 | $82,900 | $5,400 | $77,500 |
| 2016 | $1,779 | $79,500 | $5,400 | $74,100 |
| 2014 | $1,621 | $73,000 | $5,400 | $67,600 |
| 2013 | $729 | $73,000 | $5,400 | $67,600 |
Source: Public Records
Map
Nearby Homes
- 2825 S Walcott St
- 2719 S Walcott St
- 2301 Cameron St
- 2822 Tindall St
- 2853 S State Ave
- 1701 Nelson Ave
- 2874 S State Ave
- 1704 Nelson Ave
- 1656 Nelson Ave
- 3045 Asbury St
- 1621 Cruft St
- 2542 Walker Place
- 2530 Walker Place
- 1624 Bacon St
- 1820 Martin St
- 3025 S Keystone Ave
- 1514 E Gimber St
- 2512 Walker Place
- 2510 Walker Place
- 1534 Cruft St
- 2813 Dawson St
- 2825 Dawson St
- 2808 S Randolph St
- 2807 Dawson St
- 2820 S Randolph St
- 2831 Dawson St
- 2820 Dawson St
- 2826 Dawson St
- 2814 Dawson St
- 2802 S Randolph St
- 2832 Dawson St
- 2826 S Randolph St
- 2801 Dawson St
- 2837 Dawson St
- 2808 Dawson St
- 2838 Dawson St
- 2819 S Walcott St
- 2744 S Randolph St
- 2813 S Walcott St
- 2802 Dawson St