2819 Dohr St Berkeley, CA 94702
West Berkeley NeighborhoodEstimated Value: $1,359,389 - $2,105,000
3
Beds
3
Baths
1,976
Sq Ft
$849/Sq Ft
Est. Value
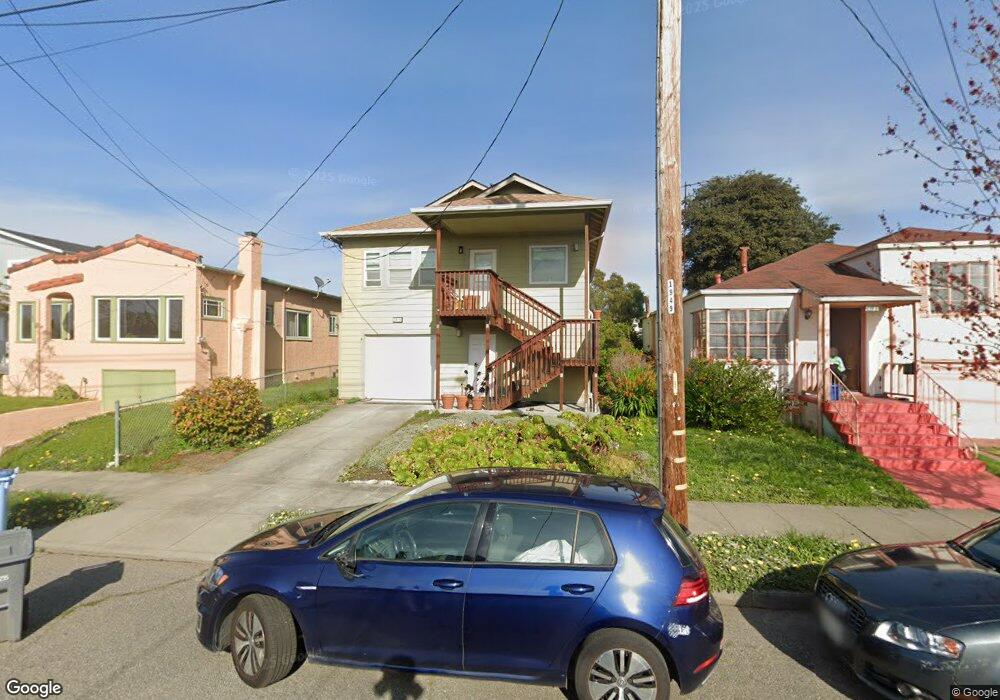
About This Home
This home is located at 2819 Dohr St, Berkeley, CA 94702 and is currently estimated at $1,677,097, approximately $848 per square foot. 2819 Dohr St is a home located in Alameda County with nearby schools including Malcolm X Elementary School, Washington Elementary School, and Oxford Elementary School.
Ownership History
Date
Name
Owned For
Owner Type
Purchase Details
Closed on
Jan 19, 1996
Sold by
Weikel Dennis L and Beckmen Michael G
Bought by
Weikel Dennis L
Current Estimated Value
Create a Home Valuation Report for This Property
The Home Valuation Report is an in-depth analysis detailing your home's value as well as a comparison with similar homes in the area
Home Values in the Area
Average Home Value in this Area
Purchase History
| Date | Buyer | Sale Price | Title Company |
|---|---|---|---|
| Weikel Dennis L | -- | -- |
Source: Public Records
Tax History
| Year | Tax Paid | Tax Assessment Tax Assessment Total Assessment is a certain percentage of the fair market value that is determined by local assessors to be the total taxable value of land and additions on the property. | Land | Improvement |
|---|---|---|---|---|
| 2025 | $8,357 | $365,994 | $62,667 | $310,327 |
| 2024 | $8,357 | $358,682 | $61,438 | $304,244 |
| 2023 | $7,925 | $358,512 | $60,233 | $298,279 |
| 2022 | $7,661 | $344,485 | $59,053 | $292,432 |
| 2021 | $7,643 | $337,593 | $57,895 | $286,698 |
| 2020 | $7,108 | $341,062 | $57,302 | $283,760 |
| 2019 | $6,690 | $334,375 | $56,178 | $278,197 |
| 2018 | $6,540 | $327,821 | $55,077 | $272,744 |
| 2017 | $6,289 | $321,395 | $53,997 | $267,398 |
| 2016 | $5,988 | $315,095 | $52,939 | $262,156 |
| 2015 | $5,890 | $310,364 | $52,144 | $258,220 |
| 2014 | $5,806 | $304,285 | $51,123 | $253,162 |
Source: Public Records
Map
Nearby Homes
- 2922 Stanton St
- 2790 Sacramento St
- 2782 Sacramento St
- 2774 Sacramento St
- 2758 Sacramento St
- 1314 Ashby Ave
- 1450 Ward St
- 2750 Sacramento St
- 1535 Julia St
- 1530 Stuart St
- 1237 Ashby Ave
- 1507 Prince St
- 3032 Mabel St
- 2751 Wallace St
- 1515 Derby St
- 3101 Sacramento St
- 2747 San Pablo Ave Unit 507
- 3110 California St
- 1646 Ashby Ave
- 3114 California St
Your Personal Tour Guide
Ask me questions while you tour the home.