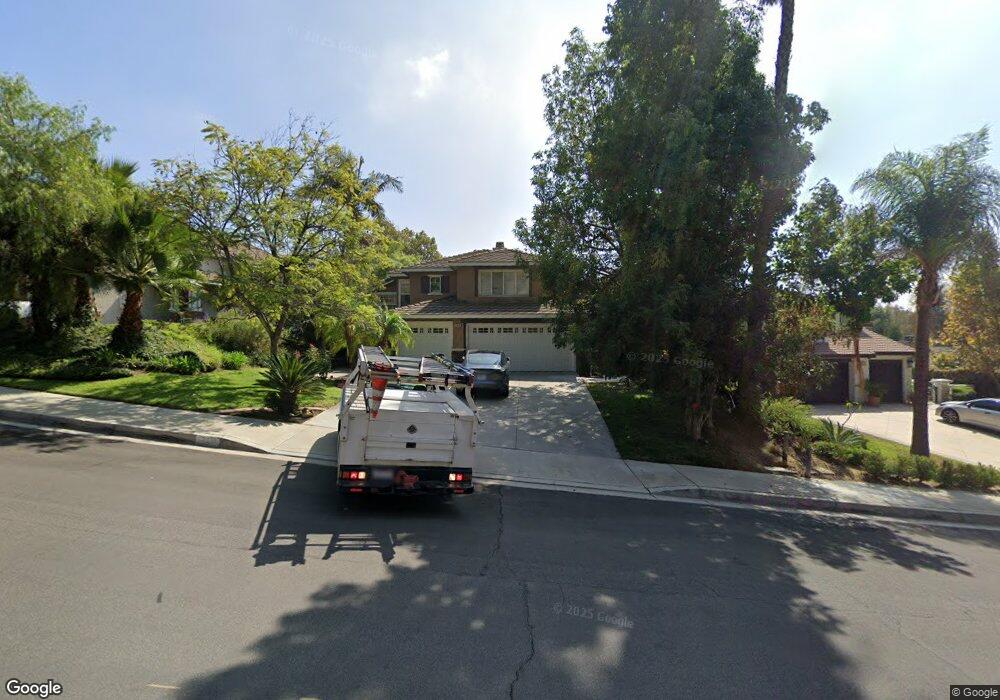
2819 Galloping Hills Rd Chino Hills, CA 91709
North Chino Hills NeighborhoodEstimated Value: $1,116,985 - $1,237,000
5
Beds
3
Baths
2,167
Sq Ft
$538/Sq Ft
Est. Value
About This Home
This home is located at 2819 Galloping Hills Rd, Chino Hills, CA 91709 and is currently estimated at $1,166,246, approximately $538 per square foot. 2819 Galloping Hills Rd is a home located in San Bernardino County with nearby schools including Gerald F. Litel Elementary School, Canyon Hills Junior High School, and Ruben S. Ayala High School.
Ownership History
Date
Name
Owned For
Owner Type
Purchase Details
Closed on
Mar 23, 1998
Sold by
Mccoy Doris M
Bought by
Mcleod Scott W and Mcleod Saadia Ahsan
Current Estimated Value
Home Financials for this Owner
Home Financials are based on the most recent Mortgage that was taken out on this home.
Original Mortgage
$217,800
Outstanding Balance
$39,985
Interest Rate
7.06%
Estimated Equity
$1,126,261
Purchase Details
Closed on
Apr 28, 1995
Sold by
Shoemaker William Grow
Bought by
Mccoy Doris
Purchase Details
Closed on
Feb 23, 1994
Sold by
Shoemaker Kelly A
Bought by
Shoemaker William G
Home Financials for this Owner
Home Financials are based on the most recent Mortgage that was taken out on this home.
Original Mortgage
$170,700
Interest Rate
7%
Purchase Details
Closed on
Feb 11, 1994
Sold by
Mccoy Ronald E
Bought by
Mccoy Doris M
Home Financials for this Owner
Home Financials are based on the most recent Mortgage that was taken out on this home.
Original Mortgage
$170,700
Interest Rate
7%
Create a Home Valuation Report for This Property
The Home Valuation Report is an in-depth analysis detailing your home's value as well as a comparison with similar homes in the area
Home Values in the Area
Average Home Value in this Area
Purchase History
| Date | Buyer | Sale Price | Title Company |
|---|---|---|---|
| Mcleod Scott W | $242,000 | North American Title Co | |
| Mccoy Doris | -- | -- | |
| Shoemaker William G | -- | First American Title Ins Co | |
| Mccoy Doris M | -- | First American Title Ins Co | |
| Mccoy Doris M | $213,500 | First American Title Ins Co |
Source: Public Records
Mortgage History
| Date | Status | Borrower | Loan Amount |
|---|---|---|---|
| Open | Mcleod Scott W | $217,800 | |
| Previous Owner | Mccoy Doris M | $170,700 |
Source: Public Records
Tax History Compared to Growth
Tax History
| Year | Tax Paid | Tax Assessment Tax Assessment Total Assessment is a certain percentage of the fair market value that is determined by local assessors to be the total taxable value of land and additions on the property. | Land | Improvement |
|---|---|---|---|---|
| 2025 | $5,010 | $422,058 | $94,844 | $327,214 |
| 2024 | $5,010 | $413,782 | $92,984 | $320,798 |
| 2023 | $4,884 | $405,669 | $91,161 | $314,508 |
| 2022 | $4,857 | $397,715 | $89,374 | $308,341 |
| 2021 | $5,999 | $389,917 | $87,622 | $302,295 |
| 2020 | $4,715 | $385,919 | $86,724 | $299,195 |
| 2019 | $4,640 | $378,352 | $85,024 | $293,328 |
| 2018 | $5,147 | $370,933 | $83,357 | $287,576 |
| 2017 | $5,061 | $363,660 | $81,723 | $281,937 |
| 2016 | $4,788 | $356,530 | $80,121 | $276,409 |
| 2015 | $4,701 | $351,175 | $78,918 | $272,257 |
| 2014 | $4,617 | $344,296 | $77,372 | $266,924 |
Source: Public Records
Map
Nearby Homes
- 2891 Galloping Hills Rd
- 14797 Maplewood Dr
- 2515 Pointe Coupee
- 2702 Avenida Marguerite
- 3159 Morningfield Dr
- 3167 Morningfield Dr
- 2460 Windmill Creek Rd
- 3199 Morningfield Dr
- 2432 Moon Dust Dr Unit B
- 14726 Moon Crest Ln Unit E
- 14748 Moon Crest Ln Unit E
- 15036 Calle la Paloma
- 2417 Brookhaven Dr
- 2286 Black Pine Rd
- 3372 Buckingham Rd
- 15358 Morningside Dr
- 3027 Spyglass Ct
- 13952 Woodrose Ct
- 3107 Morningside Dr
- 15075 Avenida Del Monte
- 2825 Galloping Hills Rd
- 2813 Galloping Hills Rd
- 2831 Galloping Hills Rd
- 2807 Galloping Hills Rd
- 2840 Mountain Hills Ln
- 2834 Mountain Hills Ln
- 2846 Mountain Hills Ln
- 2828 Mountain Hills Ln
- 2837 Galloping Hills Rd
- 2901 Galloping Hills Rd
- 2822 Mountain Hills Ln
- 2816 Mountain Hills Ln
- 2798 La Salle Pointe
- 2860 Buckhaven Rd
- 2831 Mountain Hills Ln
- 2837 Mountain Hills Ln
- 2866 Buckhaven Rd
- 2854 Buckhaven Rd
- 2792 La Salle Pointe
- 2825 Mountain Hills Ln