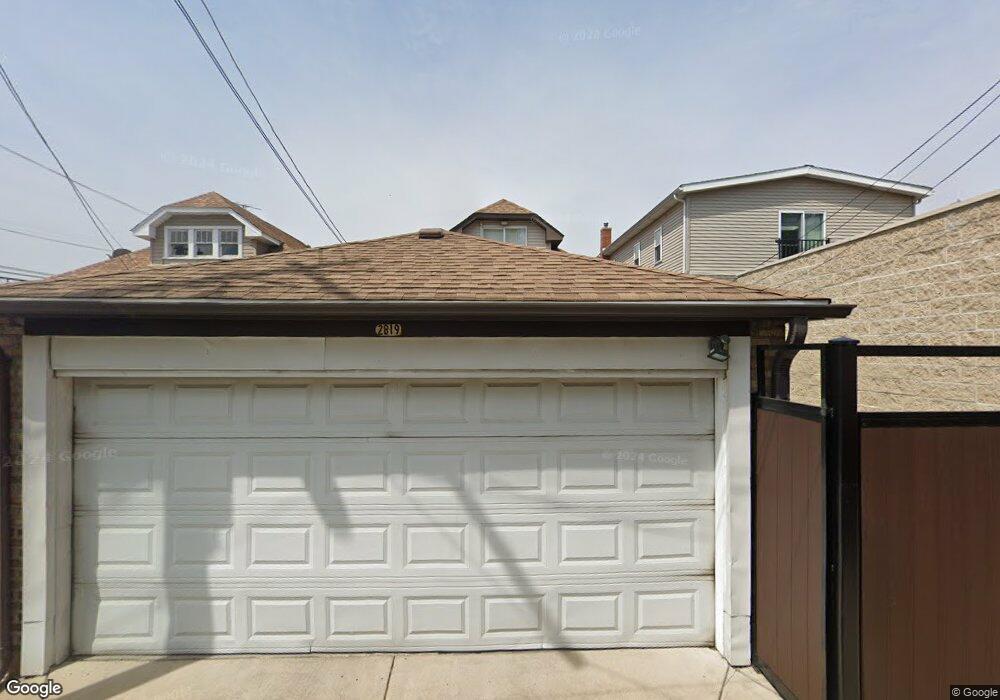
2819 N Long Ave Chicago, IL 60641
Cragin NeighborhoodEstimated Value: $405,846 - $502,000
6
Beds
3
Baths
1,402
Sq Ft
$324/Sq Ft
Est. Value
About This Home
This home is located at 2819 N Long Ave, Chicago, IL 60641 and is currently estimated at $454,212, approximately $323 per square foot. 2819 N Long Ave is a home located in Cook County with nearby schools including Schubert Elementary School, Northwest Middle School, and Foreman College and Career Academy.
Ownership History
Date
Name
Owned For
Owner Type
Purchase Details
Closed on
Jun 16, 2022
Sold by
Martinez Alfredo and Manriquez Silvia
Bought by
Manriquez Rafael and Manriquez Evangelina
Current Estimated Value
Purchase Details
Closed on
Sep 26, 2002
Sold by
Castro Angel L and Rosario Castro Midda E
Bought by
Martinez Alfredo and Manriquez Silvia
Home Financials for this Owner
Home Financials are based on the most recent Mortgage that was taken out on this home.
Original Mortgage
$193,600
Interest Rate
6.29%
Purchase Details
Closed on
Jun 24, 1996
Sold by
Glod Ryszard and Glod Lucyna
Bought by
Castro Angel L and Rosario Castro Midda E
Home Financials for this Owner
Home Financials are based on the most recent Mortgage that was taken out on this home.
Original Mortgage
$121,000
Interest Rate
8.3%
Mortgage Type
Balloon
Create a Home Valuation Report for This Property
The Home Valuation Report is an in-depth analysis detailing your home's value as well as a comparison with similar homes in the area
Home Values in the Area
Average Home Value in this Area
Purchase History
| Date | Buyer | Sale Price | Title Company |
|---|---|---|---|
| Manriquez Rafael | $350,000 | None Listed On Document | |
| Martinez Alfredo | $242,000 | -- | |
| Castro Angel L | $136,000 | Attorneys Natl Title Network |
Source: Public Records
Mortgage History
| Date | Status | Borrower | Loan Amount |
|---|---|---|---|
| Previous Owner | Martinez Alfredo | $193,600 | |
| Previous Owner | Castro Angel L | $121,000 |
Source: Public Records
Tax History Compared to Growth
Tax History
| Year | Tax Paid | Tax Assessment Tax Assessment Total Assessment is a certain percentage of the fair market value that is determined by local assessors to be the total taxable value of land and additions on the property. | Land | Improvement |
|---|---|---|---|---|
| 2024 | $4,863 | $33,001 | $6,938 | $26,063 |
| 2023 | $4,561 | $29,000 | $5,625 | $23,375 |
| 2022 | $4,561 | $29,000 | $5,625 | $23,375 |
| 2021 | $5,166 | $29,003 | $5,628 | $23,375 |
| 2020 | $5,043 | $25,726 | $4,687 | $21,039 |
| 2019 | $5,122 | $28,906 | $4,687 | $24,219 |
| 2018 | $5,412 | $30,815 | $4,687 | $26,128 |
| 2017 | $4,682 | $25,113 | $4,125 | $20,988 |
| 2016 | $4,775 | $26,324 | $4,125 | $22,199 |
| 2015 | $4,346 | $26,324 | $4,125 | $22,199 |
| 2014 | $4,063 | $24,452 | $3,750 | $20,702 |
| 2013 | $3,972 | $24,452 | $3,750 | $20,702 |
Source: Public Records
Map
Nearby Homes
- 5303 W George St
- 5254 W Wolfram St
- 4918-22 W Diversey Ave
- 2939 N Lotus Ave
- 5505 W Parker Ave
- 5330 W Drummond Place
- 3024 N Long Ave
- 3036 N Long Ave
- 5121 W Diversey Ave Unit 3S
- 5121 W Diversey Ave Unit 3N
- 5335 W Barry Ave
- 5205 W Drummond Place Unit 1
- 3043 N Laramie Ave Unit 2
- 3045 N Laramie Ave Unit 2
- 2515 N Lotus Ave
- 2503 N Lotus Ave
- 2510 N Linder Ave
- 5042 W Wellington Ave
- 2511 N Laramie Ave
- 2859 N Mango Ave
- 2815 N Long Ave
- 2821 N Long Ave
- 2825 N Long Ave Unit 3
- 5345 W Wolfram St
- 5345 W Wolfram St Unit 1
- 5354 W Diversey Ave
- 5341 W Wolfram St
- 5348 W Diversey Ave
- 5344 W Diversey Ave
- 5339 W Wolfram St
- 2835 N Long Ave Unit 2
- 2835 N Long Ave
- 5335 W Wolfram St
- 2837 N Long Ave Unit 2
- 2837 N Long Ave
- 2818 N Long Ave
- 2814 N Long Ave
- 2820 N Long Ave
- 5336 W Diversey Ave
- 2824 N Long Ave