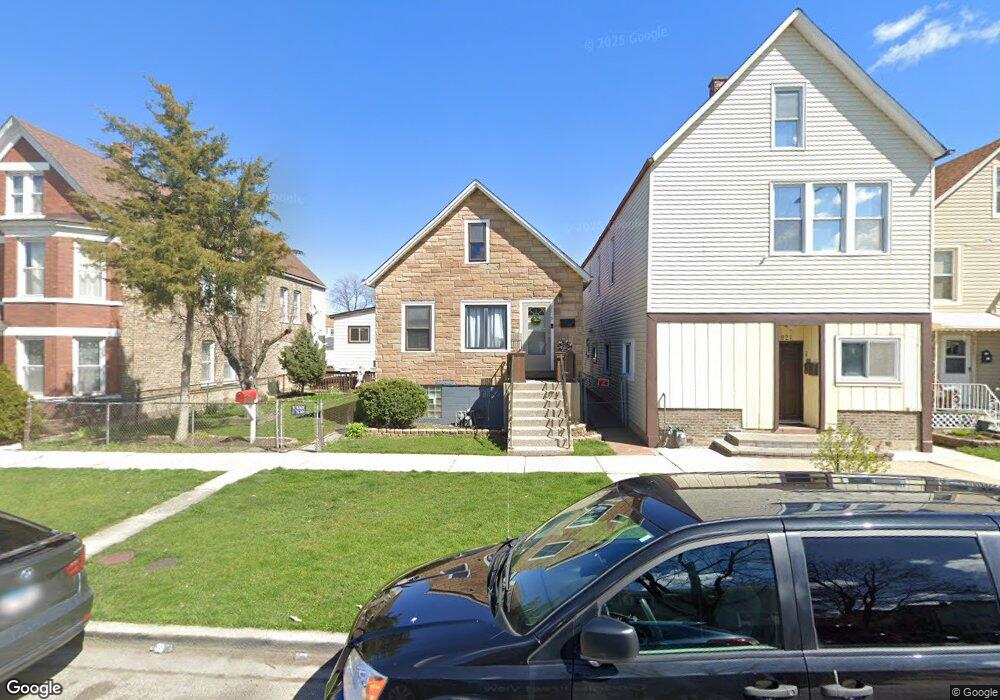
2819 S 49th Ave Cicero, IL 60804
Estimated Value: $259,967 - $367,000
3
Beds
1
Bath
1,350
Sq Ft
$220/Sq Ft
Est. Value
About This Home
This home is located at 2819 S 49th Ave, Cicero, IL 60804 and is currently estimated at $297,492, approximately $220 per square foot. 2819 S 49th Ave is a home located in Cook County with nearby schools including Columbus West Elementary School, Columbus East Elementary School, and Unity Jr High School.
Ownership History
Date
Name
Owned For
Owner Type
Purchase Details
Closed on
Apr 3, 2002
Sold by
Martinez Jose and Martinez Margarita
Bought by
Martinez Jose
Current Estimated Value
Home Financials for this Owner
Home Financials are based on the most recent Mortgage that was taken out on this home.
Original Mortgage
$82,500
Interest Rate
7.18%
Purchase Details
Closed on
Feb 23, 1999
Sold by
Vega Guillermo V and Melendez Alejandra
Bought by
Martinez Jose and Martinez Esmundo
Home Financials for this Owner
Home Financials are based on the most recent Mortgage that was taken out on this home.
Original Mortgage
$77,454
Interest Rate
6.85%
Mortgage Type
FHA
Purchase Details
Closed on
May 16, 1994
Sold by
Falkner Ann Frances
Bought by
Vega Guillermo V and Melendez Alejandra
Home Financials for this Owner
Home Financials are based on the most recent Mortgage that was taken out on this home.
Original Mortgage
$66,411
Interest Rate
8.34%
Mortgage Type
FHA
Create a Home Valuation Report for This Property
The Home Valuation Report is an in-depth analysis detailing your home's value as well as a comparison with similar homes in the area
Home Values in the Area
Average Home Value in this Area
Purchase History
| Date | Buyer | Sale Price | Title Company |
|---|---|---|---|
| Martinez Jose | -- | -- | |
| Martinez Jose | $78,000 | -- | |
| Vega Guillermo V | $66,500 | -- |
Source: Public Records
Mortgage History
| Date | Status | Borrower | Loan Amount |
|---|---|---|---|
| Closed | Martinez Jose | $82,500 | |
| Closed | Martinez Jose | $77,454 | |
| Previous Owner | Vega Guillermo V | $66,411 |
Source: Public Records
Tax History Compared to Growth
Tax History
| Year | Tax Paid | Tax Assessment Tax Assessment Total Assessment is a certain percentage of the fair market value that is determined by local assessors to be the total taxable value of land and additions on the property. | Land | Improvement |
|---|---|---|---|---|
| 2024 | $4,070 | $18,000 | $4,676 | $13,324 |
| 2023 | $3,111 | $18,000 | $4,676 | $13,324 |
| 2022 | $3,111 | $13,281 | $4,024 | $9,257 |
| 2021 | $1,583 | $13,280 | $4,023 | $9,257 |
| 2020 | $3,230 | $13,280 | $4,023 | $9,257 |
| 2019 | $3,237 | $9,966 | $3,697 | $6,269 |
| 2018 | $3,148 | $9,966 | $3,697 | $6,269 |
| 2017 | $3,063 | $9,966 | $3,697 | $6,269 |
| 2016 | $3,044 | $8,753 | $3,045 | $5,708 |
| 2015 | $2,947 | $8,753 | $3,045 | $5,708 |
| 2014 | $2,862 | $8,753 | $3,045 | $5,708 |
| 2013 | $2,826 | $9,390 | $3,045 | $6,345 |
Source: Public Records
Map
Nearby Homes
- 4916 W 29th St
- 4817 W 28th St
- 2919 S 49th Ave
- 2938 48th Ct
- 4915 W 30th St
- 3019 S 49th Ave
- 5011 W 26th St
- 5059 W 29th Place
- 5003 W 31st St
- 2304 S Laramie Ave
- 5131 W 25th Place
- 5028 W 31st Place
- 4821 W 24th St
- 5017 W 32nd St
- 3214 S 49th Ave
- 4914 W 32nd Place
- 3117 S Laramie Ave Unit 3N
- 5234 W 25th Place
- 5129 W 31st Place
- 5057 W 32nd Place
- 2821 S 49th Ave
- 2817 S 49th Ave
- 2825 S 49th Ave
- 2827 S 49th Ave
- 2811 S 49th Ave
- 2809 S 49th Ave
- 4904 28th Place
- 2805 S 49th Ave
- 4851 W 28th St
- 2816 S 48th Ct
- 2803 S 49th Ave
- 2812 S 48th Ct
- 2824 S 48th Ct
- 2810 S 48th Ct
- 2826 S 48th Ct
- 2801 S 49th Ave
- 2828 S 48th Ct
- 4901 W 28th Place
- 2806 S 48th Ct
- 2830 S 48th Ct