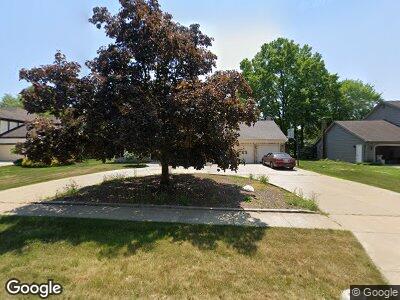
28195 Settlers Reserve Way Westlake, OH 44145
Estimated Value: $451,000 - $535,000
4
Beds
3
Baths
2,596
Sq Ft
$186/Sq Ft
Est. Value
About This Home
This home is located at 28195 Settlers Reserve Way, Westlake, OH 44145 and is currently estimated at $482,232, approximately $185 per square foot. 28195 Settlers Reserve Way is a home located in Cuyahoga County with nearby schools including Dover Intermediate School, Lee Burneson Middle School, and Westlake High School.
Ownership History
Date
Name
Owned For
Owner Type
Purchase Details
Closed on
Aug 1, 1997
Sold by
Wojciechowski David
Bought by
Pesta Kenneth J and Pesta Catherine C
Current Estimated Value
Home Financials for this Owner
Home Financials are based on the most recent Mortgage that was taken out on this home.
Original Mortgage
$174,000
Interest Rate
7.38%
Mortgage Type
New Conventional
Purchase Details
Closed on
Jun 11, 1993
Sold by
Miller Donna M
Bought by
Wojciechowski David
Purchase Details
Closed on
Mar 17, 1993
Sold by
Miller Gary M
Bought by
Miller Donna M
Purchase Details
Closed on
May 12, 1981
Bought by
Miller Gary M
Purchase Details
Closed on
Jan 1, 1979
Bought by
Hennie Homes Inc
Create a Home Valuation Report for This Property
The Home Valuation Report is an in-depth analysis detailing your home's value as well as a comparison with similar homes in the area
Home Values in the Area
Average Home Value in this Area
Purchase History
| Date | Buyer | Sale Price | Title Company |
|---|---|---|---|
| Pesta Kenneth J | $268,000 | -- | |
| Wojciechowski David | $225,000 | -- | |
| Miller Donna M | -- | -- | |
| Miller Gary M | $135,800 | -- | |
| Hennie Homes Inc | -- | -- |
Source: Public Records
Mortgage History
| Date | Status | Borrower | Loan Amount |
|---|---|---|---|
| Previous Owner | Pesta Kenneth J | $94,500 | |
| Previous Owner | Pesta Kenneth J | $171,800 | |
| Previous Owner | Pesta Kenneth J | $55,000 | |
| Previous Owner | Pesta Kenneth J | $50,000 | |
| Previous Owner | Pesta Kenneth J | $174,000 |
Source: Public Records
Tax History Compared to Growth
Tax History
| Year | Tax Paid | Tax Assessment Tax Assessment Total Assessment is a certain percentage of the fair market value that is determined by local assessors to be the total taxable value of land and additions on the property. | Land | Improvement |
|---|---|---|---|---|
| 2024 | $7,207 | $152,145 | $33,950 | $118,195 |
| 2023 | $6,470 | $116,770 | $26,990 | $89,780 |
| 2022 | $6,367 | $116,760 | $26,985 | $89,775 |
| 2021 | $6,375 | $116,760 | $26,990 | $89,780 |
| 2020 | $6,481 | $108,120 | $24,990 | $83,130 |
| 2019 | $6,239 | $308,900 | $71,400 | $237,500 |
| 2018 | $6,440 | $108,120 | $24,990 | $83,130 |
| 2017 | $6,685 | $108,470 | $24,780 | $83,690 |
| 2016 | $6,649 | $108,470 | $24,780 | $83,690 |
| 2015 | $6,048 | $108,470 | $24,780 | $83,690 |
| 2014 | $6,048 | $96,850 | $22,120 | $74,730 |
Source: Public Records
Map
Nearby Homes
- 28839 Detroit Rd
- 1889 Halls Carriage Path
- 28883 Detroit Rd
- 1826 Bassett Rd
- 28440 Detroit Rd
- 1629 Merlot Ln
- 1885 Bordeaux Way
- 29396 Detroit Rd
- 1310 Patti Park Unit G4
- 28000 Bassett Rd
- 4392 Palomar Ln
- 1636 Dover Rd
- 0 Hilliard Blvd Unit 5010479
- 250 Earley Ln
- 242 Earley Ln
- 175 Ashbourne Dr
- 110 Ashbourne Dr
- 2648 Piedmont Ct Unit 54
- 2806 Wakefield Ln
- 27428 Dellwood Dr
- 28195 Settlers Reserve Way
- 28211 Settlers Reserve Way
- 28179 Settlers Reserve Way
- 1801 Settlers Reserve Oval
- 1812 Sperrys Forge Trail
- 28163 Settlers Reserve Way
- 1807 Settlers Reserve Oval
- 28194 Settlers Reserve Way
- 28178 Settlers Reserve Way
- 1820 Sperrys Forge Trail
- 28210 Settlers Reserve Way
- 1764 Sperrys Forge Trail
- 1798 Settlers Reserve Oval
- 1790 Settlers Reserve Oval
- 1828 Sperrys Forge Trail
- 1804 Settlers Reserve Oval
- 1782 Settlers Reserve Way
- 28131 Settlers Reserve Way
- 1759 Settlers Reserve Way
- 1774 Settlers Reserve Way