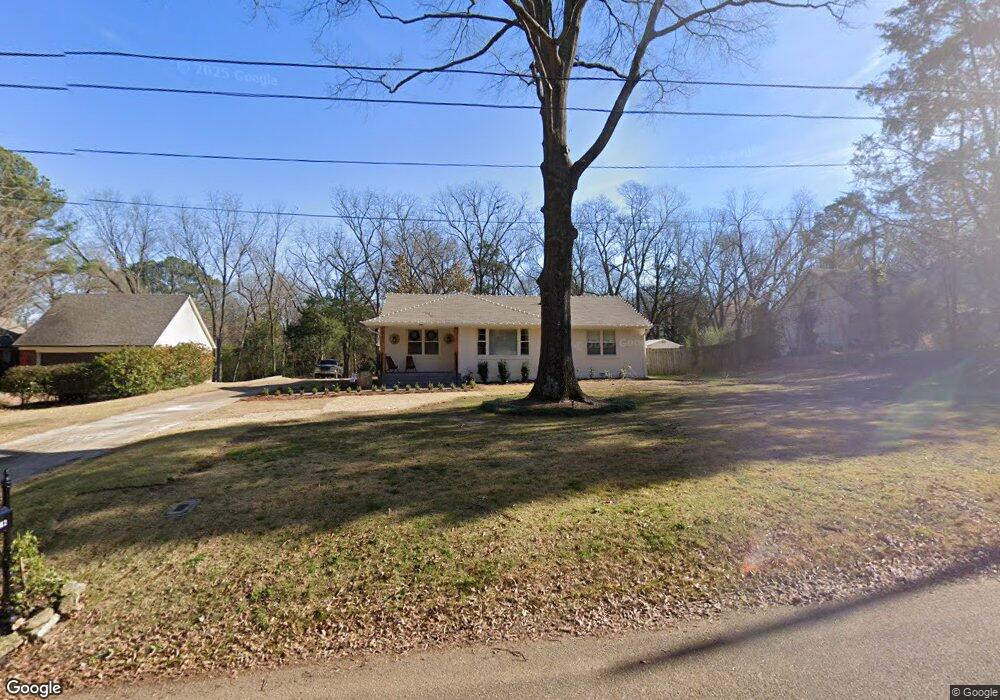
282 Burrows Rd Collierville, TN 38017
Estimated Value: $298,157 - $364,000
3
Beds
2
Baths
1,404
Sq Ft
$230/Sq Ft
Est. Value
About This Home
This home is located at 282 Burrows Rd, Collierville, TN 38017 and is currently estimated at $323,539, approximately $230 per square foot. 282 Burrows Rd is a home located in Shelby County with nearby schools including Collierville Elementary School, Collierville Middle School, and Collierville High School.
Ownership History
Date
Name
Owned For
Owner Type
Purchase Details
Closed on
Oct 14, 2020
Sold by
Stamps William T and Stamps Melissa S
Bought by
Turner Andrew and Turner Allyson
Current Estimated Value
Home Financials for this Owner
Home Financials are based on the most recent Mortgage that was taken out on this home.
Original Mortgage
$234,000
Outstanding Balance
$207,751
Interest Rate
2.8%
Mortgage Type
New Conventional
Estimated Equity
$115,788
Purchase Details
Closed on
Oct 25, 2005
Sold by
Broome Christopher and Broome H
Bought by
Stamps Ii William T and Stamps Melissa S
Purchase Details
Closed on
Apr 8, 2002
Sold by
Brewer Frances
Bought by
Broome Christopher and Broome H
Home Financials for this Owner
Home Financials are based on the most recent Mortgage that was taken out on this home.
Original Mortgage
$133,941
Interest Rate
6.8%
Mortgage Type
FHA
Create a Home Valuation Report for This Property
The Home Valuation Report is an in-depth analysis detailing your home's value as well as a comparison with similar homes in the area
Home Values in the Area
Average Home Value in this Area
Purchase History
| Date | Buyer | Sale Price | Title Company |
|---|---|---|---|
| Turner Andrew | $260,000 | None Available | |
| Stamps Ii William T | $150,500 | -- | |
| Broome Christopher | $135,000 | -- |
Source: Public Records
Mortgage History
| Date | Status | Borrower | Loan Amount |
|---|---|---|---|
| Open | Turner Andrew | $234,000 | |
| Previous Owner | Broome Christopher | $133,941 |
Source: Public Records
Tax History
| Year | Tax Paid | Tax Assessment Tax Assessment Total Assessment is a certain percentage of the fair market value that is determined by local assessors to be the total taxable value of land and additions on the property. | Land | Improvement |
|---|---|---|---|---|
| 2025 | $2,129 | $74,000 | $20,900 | $53,100 |
| 2024 | $1,953 | $57,625 | $12,200 | $45,425 |
| 2023 | $3,014 | $57,625 | $12,200 | $45,425 |
| 2022 | $2,945 | $57,625 | $12,200 | $45,425 |
| 2021 | $1,988 | $57,625 | $12,200 | $45,425 |
| 2020 | $2,159 | $36,725 | $12,200 | $24,525 |
| 2019 | $1,487 | $36,725 | $12,200 | $24,525 |
| 2018 | $1,487 | $36,725 | $12,200 | $24,525 |
| 2017 | $2,108 | $36,725 | $12,200 | $24,525 |
| 2016 | $1,410 | $32,275 | $0 | $0 |
| 2014 | $1,410 | $32,275 | $0 | $0 |
Source: Public Records
Map
Nearby Homes
- 110 W Poplar Ave
- 281 Briarbrook Cove
- 358 Wolf Trap Rd
- 396 N Main St
- 255 Ellawood Ln
- 277 Peterson Lake Rd
- 275 Ellawood Ln
- 262 E Poplar Ave
- 232 W Poplar Ave
- 255 Andrew Way Rd
- 466 Mockingbird Ln
- 431 Peterson Lake Rd
- 289 E Poplar Ave
- 279 W Poplar Ave
- 506 Peterson Lake Rd
- 409 Little Oak Ln
- 436 Sterling Dr
- 450 Fletcher Rd
- 269 Taraview Rd
- 599 Forestdale Dr
Your Personal Tour Guide
Ask me questions while you tour the home.