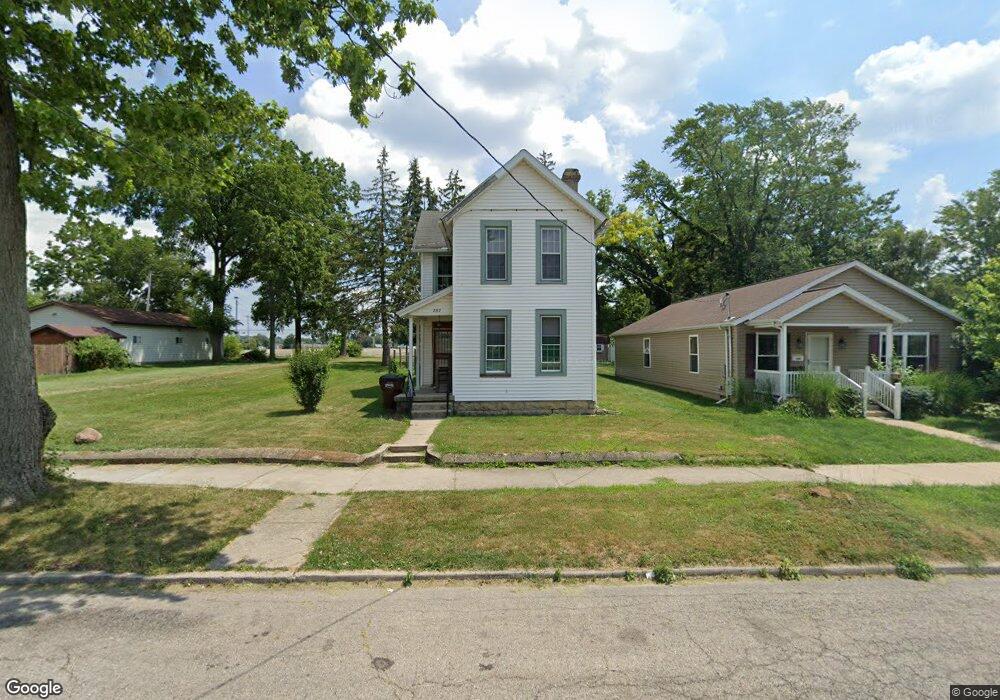
282 Buxton Ave Springfield, OH 45505
Estimated Value: $73,000 - $128,000
2
Beds
1
Bath
1,274
Sq Ft
$83/Sq Ft
Est. Value
About This Home
This home is located at 282 Buxton Ave, Springfield, OH 45505 and is currently estimated at $105,386, approximately $82 per square foot. 282 Buxton Ave is a home located in Clark County with nearby schools including Mann Elementary School, Schaefer Middle School, and Springfield High School.
Ownership History
Date
Name
Owned For
Owner Type
Purchase Details
Closed on
Apr 2, 2019
Sold by
Dotto Larry E and Dotto Sue
Bought by
Brewer Frank J
Current Estimated Value
Purchase Details
Closed on
Oct 26, 2010
Sold by
Federal Home Loan Mortgage Corporation
Bought by
Dotto Larry E and Dotto Sue
Purchase Details
Closed on
Jun 3, 2010
Sold by
Woodruff Shaun A
Bought by
Federal Home Loan Mortgage Corp
Purchase Details
Closed on
Sep 7, 2007
Sold by
Westmoreland Bonnie L
Bought by
Woodruff Shaun A
Home Financials for this Owner
Home Financials are based on the most recent Mortgage that was taken out on this home.
Original Mortgage
$25,000
Interest Rate
6.72%
Mortgage Type
Purchase Money Mortgage
Purchase Details
Closed on
Mar 14, 2007
Sold by
Estate Of Mary E Stanley
Bought by
Westmoreland Bonnie L
Purchase Details
Closed on
Sep 1, 1998
Sold by
Estate Of Fred R Stanley
Bought by
Stanley Mary and Stanley Mary E
Create a Home Valuation Report for This Property
The Home Valuation Report is an in-depth analysis detailing your home's value as well as a comparison with similar homes in the area
Home Values in the Area
Average Home Value in this Area
Purchase History
| Date | Buyer | Sale Price | Title Company |
|---|---|---|---|
| Brewer Frank J | -- | None Available | |
| Dotto Larry E | $20,000 | Community First Title Agency | |
| Federal Home Loan Mortgage Corp | $20,000 | None Available | |
| Woodruff Shaun A | $32,000 | Attorney | |
| Westmoreland Bonnie L | -- | None Available | |
| Stanley Mary | -- | -- |
Source: Public Records
Mortgage History
| Date | Status | Borrower | Loan Amount |
|---|---|---|---|
| Previous Owner | Woodruff Shaun A | $25,000 |
Source: Public Records
Tax History
| Year | Tax Paid | Tax Assessment Tax Assessment Total Assessment is a certain percentage of the fair market value that is determined by local assessors to be the total taxable value of land and additions on the property. | Land | Improvement |
|---|---|---|---|---|
| 2025 | $1,267 | $31,740 | $6,470 | $25,270 |
| 2024 | $1,914 | $25,000 | $5,960 | $19,040 |
| 2023 | $1,235 | $25,000 | $5,960 | $19,040 |
| 2022 | $1,961 | $25,000 | $5,960 | $19,040 |
| 2021 | $1,073 | $19,530 | $4,620 | $14,910 |
| 2020 | $1,076 | $19,530 | $4,620 | $14,910 |
| 2019 | $1,078 | $19,530 | $4,620 | $14,910 |
| 2018 | $1,122 | $19,510 | $5,250 | $14,260 |
| 2017 | $1,121 | $19,506 | $5,250 | $14,256 |
| 2016 | $1,123 | $19,506 | $5,250 | $14,256 |
| 2015 | $1,217 | $20,727 | $5,250 | $15,477 |
| 2014 | $1,211 | $20,727 | $5,250 | $15,477 |
| 2013 | $1,198 | $20,727 | $5,250 | $15,477 |
Source: Public Records
Map
Nearby Homes
- 2425 Kenilworth Ave
- 360 Buxton Ave
- 374 Raffensperger Ave
- 115 S Burnett Rd
- 250 S Douglas Ave Unit 254
- 2702 Maplewood Ave
- 2338 Dellwood Dr
- 129 N Burnett Rd
- 2804 Lowman St
- 2730 E Main St
- 2745 Share St
- 26 N Belmont Ave
- 2409 Mayfair Dr
- 138 Lawnview Ave
- 451 Lawnview Ave
- 3012 E High St
- 375 N Fostoria Ave
- 1011 Mount Joy St
- 1585 Mound St
- 1609 Irwin Ave
- 274 Buxton Ave
- 284 Buxton Ave
- 268 Buxton Ave
- 302 Buxton Ave
- 264 Buxton Ave
- 283 Buxton Ave
- 314 Buxton Ave
- 258 Buxton Ave
- 301 Buxton Ave
- 271 Buxton Ave
- 269 Buxton Ave
- 252 Buxton Ave
- 263 Buxton Ave
- 309 Buxton Ave Unit 311
- 2426 Virginia Ave
- 259 Buxton Ave
- 257 Buxton Ave
- 2424 Virginia Ave
- 319 Buxton Ave
- 2420 Virginia Ave
Your Personal Tour Guide
Ask me questions while you tour the home.