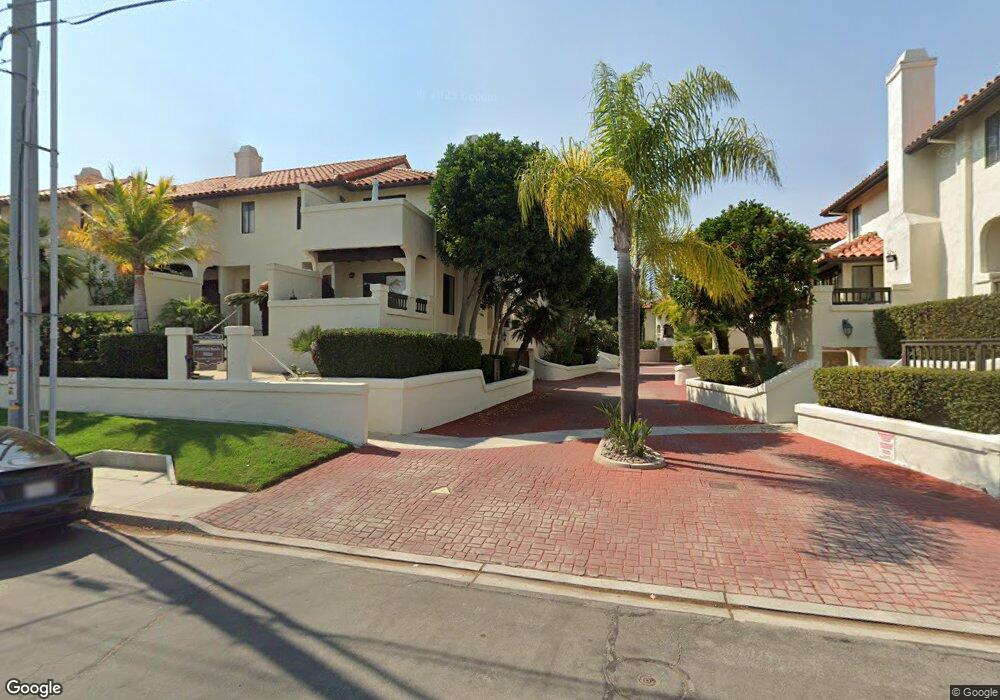
282 Chinquapin Ave Unit C Carlsbad, CA 92008
North Beach NeighborhoodEstimated Value: $1,058,075 - $1,386,000
2
Beds
3
Baths
1,344
Sq Ft
$959/Sq Ft
Est. Value
About This Home
This home is located at 282 Chinquapin Ave Unit C, Carlsbad, CA 92008 and is currently estimated at $1,289,519, approximately $959 per square foot. 282 Chinquapin Ave Unit C is a home located in San Diego County with nearby schools including Carlsbad High School, Sage Creek High, and St. Patrick Catholic School.
Ownership History
Date
Name
Owned For
Owner Type
Purchase Details
Closed on
Oct 18, 2022
Sold by
Nastase Robert
Bought by
Nastase Family Trust
Current Estimated Value
Purchase Details
Closed on
May 28, 1998
Sold by
Snyder John H and Miedema Kennon G
Bought by
Nastase Robert and Nastase Barbara
Home Financials for this Owner
Home Financials are based on the most recent Mortgage that was taken out on this home.
Original Mortgage
$184,000
Interest Rate
6.88%
Mortgage Type
Stand Alone First
Purchase Details
Closed on
Dec 14, 1993
Sold by
Snyder John H and Miedema Kennon G
Bought by
Snyder John H and Miedema Kennon G
Home Financials for this Owner
Home Financials are based on the most recent Mortgage that was taken out on this home.
Original Mortgage
$106,400
Interest Rate
7.09%
Purchase Details
Closed on
Sep 16, 1985
Create a Home Valuation Report for This Property
The Home Valuation Report is an in-depth analysis detailing your home's value as well as a comparison with similar homes in the area
Home Values in the Area
Average Home Value in this Area
Purchase History
| Date | Buyer | Sale Price | Title Company |
|---|---|---|---|
| Nastase Family Trust | -- | -- | |
| Nastase Robert | $230,000 | Chicago Title Company | |
| Snyder John H | -- | Southland Title Corporation | |
| Snyder John H | -- | Southland Title Corporation | |
| -- | $142,900 | -- |
Source: Public Records
Mortgage History
| Date | Status | Borrower | Loan Amount |
|---|---|---|---|
| Previous Owner | Nastase Robert | $184,000 | |
| Previous Owner | Snyder John H | $106,400 |
Source: Public Records
Tax History Compared to Growth
Tax History
| Year | Tax Paid | Tax Assessment Tax Assessment Total Assessment is a certain percentage of the fair market value that is determined by local assessors to be the total taxable value of land and additions on the property. | Land | Improvement |
|---|---|---|---|---|
| 2025 | $3,794 | $360,547 | $171,569 | $188,978 |
| 2024 | $3,794 | $353,478 | $168,205 | $185,273 |
| 2023 | $3,774 | $346,548 | $164,907 | $181,641 |
| 2022 | $3,716 | $339,754 | $161,674 | $178,080 |
| 2021 | $3,688 | $333,093 | $158,504 | $174,589 |
| 2020 | $3,664 | $329,678 | $156,879 | $172,799 |
| 2019 | $3,598 | $323,214 | $153,803 | $169,411 |
| 2018 | $3,446 | $316,878 | $150,788 | $166,090 |
| 2017 | $3,389 | $310,666 | $147,832 | $162,834 |
| 2016 | $3,253 | $304,576 | $144,934 | $159,642 |
| 2015 | $3,240 | $300,002 | $142,757 | $157,245 |
| 2014 | $3,186 | $294,126 | $139,961 | $154,165 |
Source: Public Records
Map
Nearby Homes
- 310-326 Chinquapin Ave
- 312 Chinquapin Ave
- 314 Chinquapin Ave
- 320 Chinquapin Ave
- 324 Chinquapin Ave
- 334 Date Ave
- 370 Tamarack Ave
- 111 Sequoia Ave Unit C
- 4007 Canario St Unit E
- 368 Hemlock Ave
- 160 Hemlock Ave
- 256 Juniper Ave Unit B6
- 801 Kalpati Cir Unit B
- 141 Cherry Ave
- 3575 Madison St
- 157 Maple Ave
- 4031 Aidan Cir Unit 1205
- 4007 Bluff View Way
- 1170 Chinquapin Ave
- 1199 Tamarack Ave
- 288 Chinquapin Ave Unit ID1248661P
- 290 Chinquapin Ave Unit 4
- 286 Chinquapin Ave
- 292 Chinquapin Ave Unit B
- 292 Chinquapin Ave Unit A
- 298 Chinquapin Ave Unit B
- 298 Chinquapin Ave Unit A
- 280 Chinquapin Ave Unit A
- 280 Chinquapin Ave Unit B
- 280 Chinquapin Ave Unit C
- 282 Chinquapin Ave Unit A
- 282 Chinquapin Ave Unit B
- 286 Chinquapin Ave Unit A
- 286 Chinquapin Ave Unit B
- 286 Chinquapin Ave Unit C
- 288 Chinquapin Ave Unit A
- 288 Chinquapin Ave Unit B
- 288 Chinquapin Ave Unit C
- 290 Chinquapin Ave Unit A
- 290 Chinquapin Ave Unit C