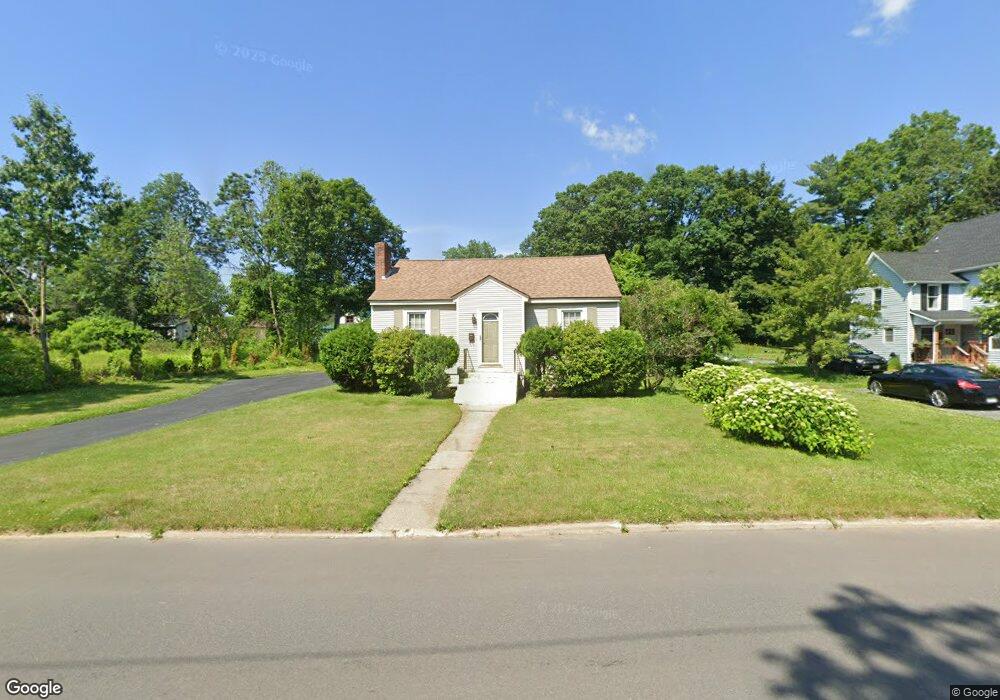
282 Conway St Greenfield, MA 01301
Estimated Value: $291,000 - $332,000
3
Beds
1
Bath
1,222
Sq Ft
$256/Sq Ft
Est. Value
About This Home
This home is located at 282 Conway St, Greenfield, MA 01301 and is currently estimated at $312,859, approximately $256 per square foot. 282 Conway St is a home located in Franklin County with nearby schools including Cornerstone Christian School and Holy Trinity School.
Ownership History
Date
Name
Owned For
Owner Type
Purchase Details
Closed on
Jul 26, 2013
Sold by
Clark Sally A
Bought by
Churchill Collin G
Current Estimated Value
Home Financials for this Owner
Home Financials are based on the most recent Mortgage that was taken out on this home.
Original Mortgage
$108,000
Outstanding Balance
$79,049
Interest Rate
4%
Mortgage Type
New Conventional
Estimated Equity
$233,810
Purchase Details
Closed on
Jul 1, 1994
Sold by
Crocker Regis M and Sweeley Mary E
Bought by
Ormond Sally A
Create a Home Valuation Report for This Property
The Home Valuation Report is an in-depth analysis detailing your home's value as well as a comparison with similar homes in the area
Home Values in the Area
Average Home Value in this Area
Purchase History
| Date | Buyer | Sale Price | Title Company |
|---|---|---|---|
| Churchill Collin G | $135,000 | -- | |
| Churchill Collin G | $135,000 | -- | |
| Ormond Sally A | $77,000 | -- | |
| Ormond Sally A | $77,000 | -- |
Source: Public Records
Mortgage History
| Date | Status | Borrower | Loan Amount |
|---|---|---|---|
| Open | Ormond Sally A | $108,000 | |
| Closed | Ormond Sally A | $108,000 |
Source: Public Records
Tax History Compared to Growth
Tax History
| Year | Tax Paid | Tax Assessment Tax Assessment Total Assessment is a certain percentage of the fair market value that is determined by local assessors to be the total taxable value of land and additions on the property. | Land | Improvement |
|---|---|---|---|---|
| 2025 | $5,217 | $266,700 | $46,500 | $220,200 |
| 2024 | $5,295 | $259,700 | $42,400 | $217,300 |
| 2023 | $4,753 | $241,900 | $42,400 | $199,500 |
| 2022 | $4,598 | $206,000 | $40,400 | $165,600 |
| 2021 | $4,286 | $184,600 | $43,500 | $141,100 |
| 2020 | $4,013 | $175,000 | $39,400 | $135,600 |
| 2019 | $3,801 | $170,000 | $34,400 | $135,600 |
| 2018 | $3,737 | $166,600 | $33,700 | $132,900 |
| 2017 | $3,592 | $165,300 | $33,700 | $131,600 |
| 2016 | $3,394 | $155,600 | $29,300 | $126,300 |
| 2015 | $3,415 | $151,700 | $29,600 | $122,100 |
| 2014 | $3,114 | $151,700 | $29,600 | $122,100 |
Source: Public Records
Map
Nearby Homes
- 284 Conway St
- 243 Elm St
- 281 Conway St
- 278 Conway St
- 277 Conway St
- 285 Conway St
- 235 Elm St
- 290 Conway St
- 287 Conway St Unit 289
- 295 Conway St Unit 297
- 291 Conway St Unit 293
- 233 Elm St
- 233 Elm St Unit 233 Elm St
- 9 Frederick Rd
- 238 Elm St
- 273 Conway St
- 270 Conway St
- 269 Conway St
- 12 Spruce St
- 229 Elm St