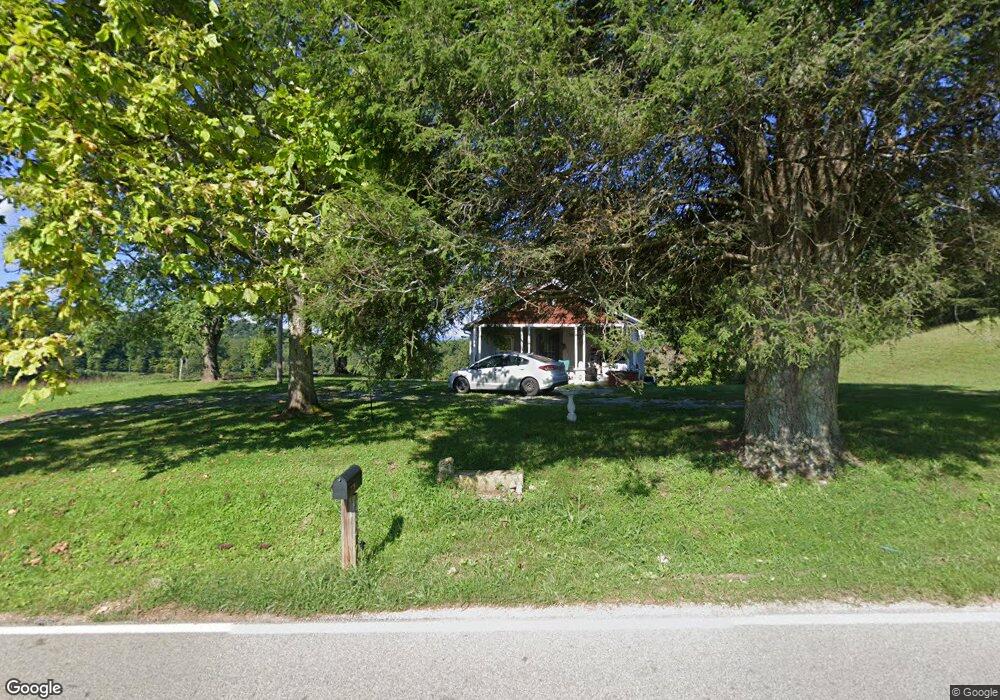
282 Grantsboro Rd La Follette, TN 37766
Estimated Value: $52,000 - $206,000
--
Bed
1
Bath
868
Sq Ft
$159/Sq Ft
Est. Value
About This Home
This home is located at 282 Grantsboro Rd, La Follette, TN 37766 and is currently estimated at $138,214, approximately $159 per square foot. 282 Grantsboro Rd is a home located in Campbell County.
Ownership History
Date
Name
Owned For
Owner Type
Purchase Details
Closed on
Nov 9, 2023
Sold by
Mccullah Samuel and Mccullah Cara
Bought by
Mccullah Alexis
Current Estimated Value
Purchase Details
Closed on
Oct 28, 2021
Sold by
Shown Stephen Archie
Bought by
Carroll David
Purchase Details
Closed on
Sep 14, 2017
Sold by
Nelson Michael G
Bought by
Archie Stephen
Purchase Details
Closed on
Nov 9, 2016
Sold by
Michael G Nelson
Bought by
Nelson Michael and Nelson Sharon
Home Financials for this Owner
Home Financials are based on the most recent Mortgage that was taken out on this home.
Original Mortgage
$3,500
Interest Rate
3.54%
Purchase Details
Closed on
Feb 10, 2013
Bought by
Brown Nathan F and Brown Darlene
Purchase Details
Closed on
Dec 11, 1984
Bought by
Brown Geneva Etvir Charles D
Purchase Details
Closed on
Sep 14, 1984
Purchase Details
Closed on
Sep 7, 1976
Create a Home Valuation Report for This Property
The Home Valuation Report is an in-depth analysis detailing your home's value as well as a comparison with similar homes in the area
Home Values in the Area
Average Home Value in this Area
Purchase History
| Date | Buyer | Sale Price | Title Company |
|---|---|---|---|
| Mccullah Alexis | -- | None Listed On Document | |
| Mccullah Alexis | -- | None Listed On Document | |
| Carroll David | $20,000 | None Available | |
| Archie Stephen | $15,000 | None Available | |
| Nelson Michael | -- | -- | |
| Brown Nathan F | -- | -- | |
| Brown Geneva Etvir Charles D | -- | -- | |
| -- | -- | -- | |
| -- | -- | -- |
Source: Public Records
Mortgage History
| Date | Status | Borrower | Loan Amount |
|---|---|---|---|
| Previous Owner | Not Available | $3,500 | |
| Previous Owner | Not Available | -- |
Source: Public Records
Tax History Compared to Growth
Tax History
| Year | Tax Paid | Tax Assessment Tax Assessment Total Assessment is a certain percentage of the fair market value that is determined by local assessors to be the total taxable value of land and additions on the property. | Land | Improvement |
|---|---|---|---|---|
| 2025 | $150 | $12,350 | $0 | $0 |
| 2024 | $150 | $12,350 | $3,100 | $9,250 |
| 2023 | $116 | $5,600 | $1,750 | $3,850 |
| 2022 | $116 | $5,600 | $1,750 | $3,850 |
| 2021 | $116 | $5,600 | $1,750 | $3,850 |
| 2020 | $114 | $5,600 | $1,750 | $3,850 |
| 2019 | $116 | $5,600 | $1,750 | $3,850 |
| 2018 | $116 | $5,150 | $1,700 | $3,450 |
| 2017 | $116 | $5,150 | $1,700 | $3,450 |
| 2016 | $116 | $5,150 | $1,700 | $3,450 |
| 2015 | $102 | $5,150 | $1,700 | $3,450 |
| 2014 | -- | $5,150 | $1,700 | $3,450 |
| 2013 | -- | $5,150 | $1,700 | $3,450 |
Source: Public Records
Map
Nearby Homes
- 268 Cross View Ln
- 0 Cross View Ln Unit 1312951
- 0 Low Gap Rd Unit 18767562
- 0 Low Gap Rd Unit 11277254
- 0 Clearwater View Ln Unit 1317048
- 0 Grantsboro Rd
- 4160 Demory Rd
- 165 Parkview Dr
- 0 Rainbow Cir
- 0 Rainbow View Rd
- Lots 8 & 9 Rainbow Ln
- 156 Smokeys Point
- 0 Whitman Hollow Rd Unit 1271817
- 711 Jim Lee Ridge Rd
- 113 Laurel Way
- 106 Laurel Way
- 125 Old Hearth
- 42 Old Hearth
- #43 Old Hearth
- 1031 Big Creek Rd
- 300 Grantsboro Rd
- 154 Leroy Day Ln
- 272 Grantsboro Rd
- 121 Leroy Day Ln
- 357 Grantsboro Rd
- 153 Leroy Day Ln
- 138 Cross View Ln
- 129 Cross View Ln
- 153 Cross View Ln
- 409 Grantsboro Rd
- 274 Grantsboro Rd
- 274 Grantsboro Rd
- 190 Cross View Ln
- 258 Cross View Ln
- 195 Cross View Ln
- 203 Cross View Ln
- 256 Cross View Ln
- 240 Cross View Ln
- 213 Cross View Ln
- 213 Cross View Ln