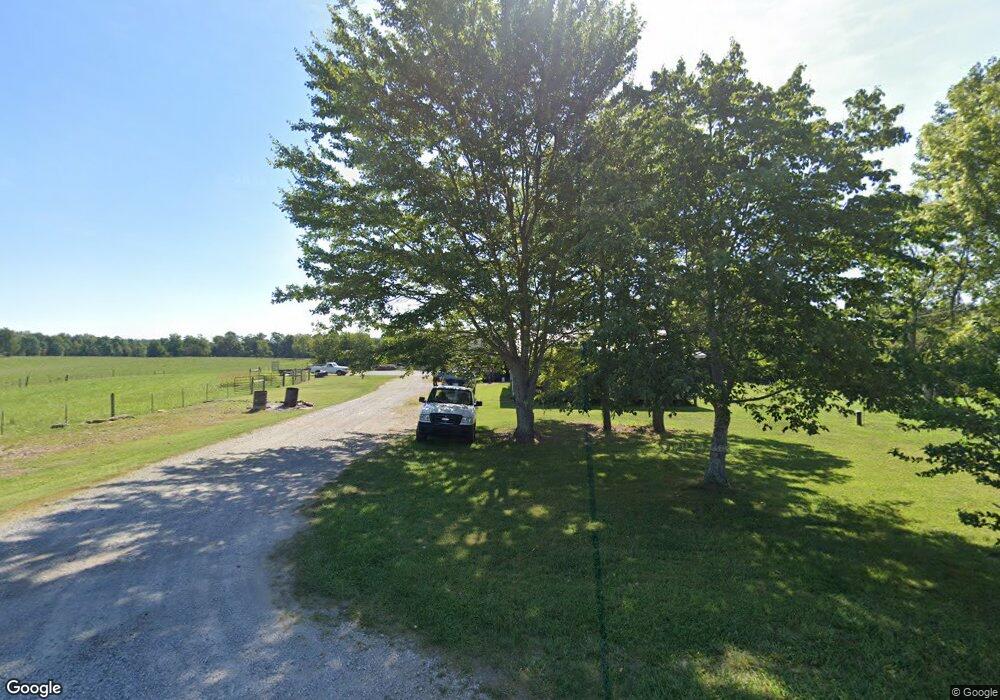
282 Omaha Gap Rd Sparta, TN 38583
Estimated Value: $159,000 - $232,000
Studio
--
Bath
1,020
Sq Ft
$191/Sq Ft
Est. Value
About This Home
This home is located at 282 Omaha Gap Rd, Sparta, TN 38583 and is currently estimated at $194,510, approximately $190 per square foot. 282 Omaha Gap Rd is a home located in White County with nearby schools including Bon De Croft Elementary School, White County Middle School, and White County High School.
Ownership History
Date
Name
Owned For
Owner Type
Purchase Details
Closed on
Nov 21, 2013
Bought by
Pack Edward and Pack Sherry
Current Estimated Value
Purchase Details
Closed on
Apr 22, 2008
Sold by
Orris Stanley R
Bought by
Eddie Pack
Home Financials for this Owner
Home Financials are based on the most recent Mortgage that was taken out on this home.
Original Mortgage
$31,991
Interest Rate
5.82%
Purchase Details
Closed on
Jul 21, 2005
Sold by
Sally Sanders
Bought by
Juanita Orris
Purchase Details
Closed on
Aug 23, 2004
Sold by
Corbin Lewis
Bought by
Sallie Sanders
Purchase Details
Closed on
Feb 16, 2001
Bought by
Sanders Sallie
Purchase Details
Closed on
Nov 29, 1999
Sold by
Corbin Lewis and Corbin Doris
Bought by
Corbin Lewis and Corbin Frances
Purchase Details
Closed on
Mar 13, 1992
Bought by
Corbin Lewis and Corbin Doris
Purchase Details
Closed on
Jan 31, 1990
Bought by
Fish Ben and Rosie Mae
Purchase Details
Closed on
Jan 1, 1990
Bought by
Roberts Charlie
Create a Home Valuation Report for This Property
The Home Valuation Report is an in-depth analysis detailing your home's value as well as a comparison with similar homes in the area
Purchase History
| Date | Buyer | Sale Price | Title Company |
|---|---|---|---|
| Pack Edward | -- | -- | |
| Eddie Pack | $37,500 | -- | |
| Juanita Orris | $62,000 | -- | |
| Sallie Sanders | $34,500 | -- | |
| Sanders Sallie | $34,500 | -- | |
| Corbin Lewis | -- | -- | |
| Corbin Lewis | $11,500 | -- | |
| Fish Ben | $6,000 | -- | |
| Roberts Charlie | -- | -- |
Source: Public Records
Mortgage History
| Date | Status | Borrower | Loan Amount |
|---|---|---|---|
| Previous Owner | Roberts Charlie | $31,991 |
Source: Public Records
Tax History
| Year | Tax Paid | Tax Assessment Tax Assessment Total Assessment is a certain percentage of the fair market value that is determined by local assessors to be the total taxable value of land and additions on the property. | Land | Improvement |
|---|---|---|---|---|
| 2025 | $676 | $47,925 | $11,425 | $36,500 |
| 2024 | $635 | $31,000 | $6,700 | $24,300 |
| 2023 | $636 | $31,000 | $6,700 | $24,300 |
| 2022 | $636 | $31,000 | $6,700 | $24,300 |
| 2021 | $636 | $31,000 | $6,700 | $24,300 |
| 2020 | $636 | $31,000 | $6,700 | $24,300 |
| 2019 | $255 | $12,450 | $6,700 | $5,750 |
| 2018 | $255 | $12,450 | $6,700 | $5,750 |
| 2017 | $255 | $12,450 | $6,700 | $5,750 |
| 2016 | $255 | $12,450 | $6,700 | $5,750 |
| 2015 | $230 | $12,450 | $6,700 | $5,750 |
| 2014 | -- | $12,450 | $6,700 | $5,750 |
| 2013 | -- | $13,425 | $6,700 | $6,725 |
Source: Public Records
Map
Nearby Homes
- Lot 213 Buck Loop
- 0 N Star Rd Unit 3
- 00 Viola Dr
- 733 Wigwam St
- 306 Viola Dr
- Lot 3 N Star Rd
- 2783 Glade Creek Rd
- 270 Rich Loop
- 500 Moonlight Trail
- 480 Moonlight Trail
- Lot 101 Rich Loop
- Lot 99 Rich Loop
- Lot 100 Rich Loop
- 170 Perrigan Ln
- 269 Moonlight Trail
- 3773 Glade Creek Rd
- lot 29 Woodland Trail
- 435 Idlewild Dr
- 365 Spring Haven Ln
- 8607 Crossville Hwy
- 324 Omaha Gap Rd
- 00 Omaha Gap Rd
- 2612 W Ravenscroft Rd
- 2619 W Ravenscroft Rd
- 556 Omaha Gap Rd
- 266 Fish Rd
- 196 Fish Rd
- 138 Fish Rd
- 2472 W Ravenscroft Rd
- 2471 W Ravenscroft Rd
- 5 acre Bon Air Ave
- 0 Bon Air Ave
- 00 Glade Creek Rd
- 323 Fish Ave
- 0 Fish Rd Unit 1151479
- 530 Glade Creek Rd
- 711 Omaha Gap Rd
- 577 Omaha Gap Rd
- 187 Cody Dr
- 2131 W Ravenscroft Rd
Your Personal Tour Guide
Ask me questions while you tour the home.