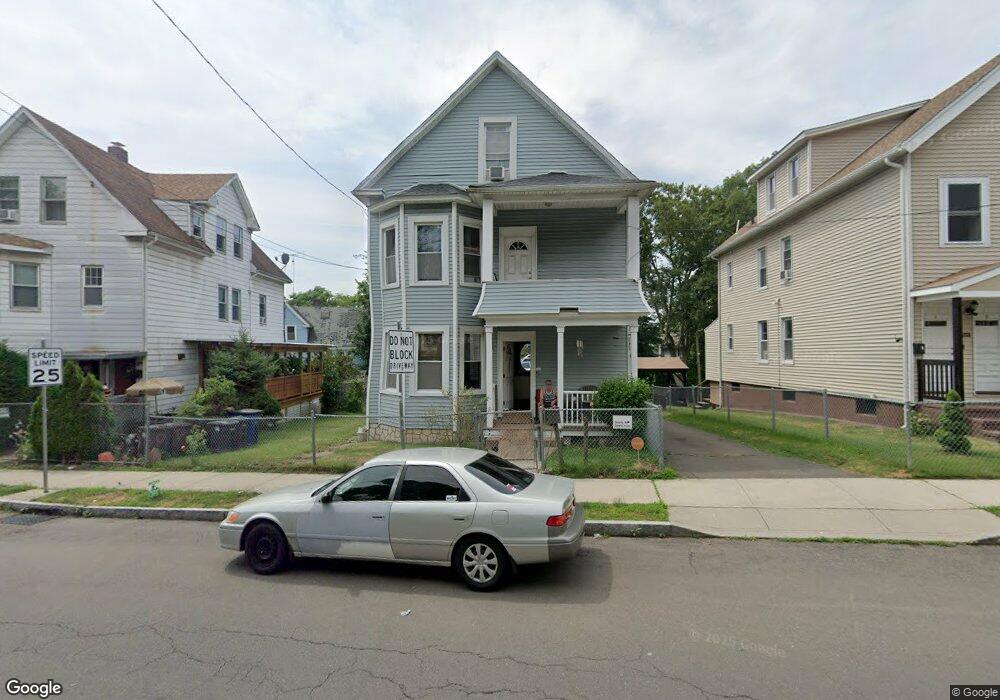
282 Quinnipiac Ave New Haven, CT 06513
Fair Haven Heights NeighborhoodEstimated Value: $336,000 - $369,000
5
Beds
3
Baths
2,192
Sq Ft
$160/Sq Ft
Est. Value
About This Home
This home is located at 282 Quinnipiac Ave, New Haven, CT 06513 and is currently estimated at $351,282, approximately $160 per square foot. 282 Quinnipiac Ave is a home located in New Haven County with nearby schools including Ross Woodward, Cold Spring School, and St Francis & St Rose Of Lima School.
Ownership History
Date
Name
Owned For
Owner Type
Purchase Details
Closed on
Jun 8, 1994
Sold by
Conforte Frank A and Conforte Roseann
Bought by
Nieves William and Nieves Norma
Current Estimated Value
Home Financials for this Owner
Home Financials are based on the most recent Mortgage that was taken out on this home.
Original Mortgage
$64,000
Interest Rate
8.29%
Mortgage Type
Unknown
Create a Home Valuation Report for This Property
The Home Valuation Report is an in-depth analysis detailing your home's value as well as a comparison with similar homes in the area
Home Values in the Area
Average Home Value in this Area
Purchase History
| Date | Buyer | Sale Price | Title Company |
|---|---|---|---|
| Nieves William | $66,000 | -- |
Source: Public Records
Mortgage History
| Date | Status | Borrower | Loan Amount |
|---|---|---|---|
| Open | Nieves William | $30,172 | |
| Closed | Nieves William | $30,000 | |
| Closed | Nieves William | $64,000 |
Source: Public Records
Tax History Compared to Growth
Tax History
| Year | Tax Paid | Tax Assessment Tax Assessment Total Assessment is a certain percentage of the fair market value that is determined by local assessors to be the total taxable value of land and additions on the property. | Land | Improvement |
|---|---|---|---|---|
| 2025 | $5,990 | $152,040 | $41,860 | $110,180 |
| 2024 | $5,854 | $152,040 | $41,860 | $110,180 |
| 2023 | $5,656 | $152,040 | $41,860 | $110,180 |
| 2022 | $6,044 | $152,040 | $41,860 | $110,180 |
| 2021 | $4,343 | $98,980 | $27,440 | $71,540 |
| 2020 | $4,343 | $98,980 | $27,440 | $71,540 |
| 2019 | $4,001 | $93,100 | $27,440 | $65,660 |
| 2018 | $4,001 | $93,100 | $27,440 | $65,660 |
| 2017 | $3,601 | $93,100 | $27,440 | $65,660 |
| 2016 | $3,383 | $81,410 | $25,900 | $55,510 |
| 2015 | $3,383 | $81,410 | $25,900 | $55,510 |
| 2014 | $3,383 | $81,410 | $25,900 | $55,510 |
Source: Public Records
Map
Nearby Homes
- 12 E Ferry St
- 193 Farren Ave
- 172 Quinnipiac Ave
- 190 Farren Ave
- 196 Farren Ave
- 28 Farren Ave
- 95 Lenox St Unit L
- 74 Milton St
- 121 Lexington Ave Unit 21
- 1 Front St Unit 1 Kel
- 533 Quinnipiac Ave
- 33 Chapel St
- 225 Fulton Terrace
- 32 E Pearl St
- 8 Front St Unit D
- 43 E Pearl St
- 20 Ashland Place
- 191 Ferry St
- 111 Chapel St
- 265 Lexington Ave
- 274 Quinnipiac Ave
- 288 Quinnipiac Ave
- 82 Lancraft St
- 82 Lancraft St Unit 1
- 82 Lancraft St Unit 2
- 294 Quinnipiac Ave Unit 2R
- 294 Quinnipiac Ave
- 78 Lancraft St
- 300 Quinnipiac Ave
- 289 Quinnipiac Ave
- 262 Quinnipiac Ave
- 81 Lancraft St
- 35 Pardee St
- 269 Quinnipiac Ave
- 310 Quinnipiac Ave
- 43 Pardee St
- 263 Quinnipiac Ave
- 263 Quinnipiac Ave Unit 1
- 263 Quinnipiac Ave Unit 2
- 47 Pardee St