282 Turning Lay Rd Morganton, GA 30560
Estimated Value: $379,000 - $545,000
--
Bed
--
Bath
1,638
Sq Ft
$286/Sq Ft
Est. Value
About This Home
This home is located at 282 Turning Lay Rd, Morganton, GA 30560 and is currently estimated at $468,294, approximately $285 per square foot. 282 Turning Lay Rd is a home with nearby schools including Fannin County High School and Mountain Area Christian Academy.
Ownership History
Date
Name
Owned For
Owner Type
Purchase Details
Closed on
Feb 16, 2021
Sold by
Case Carol
Bought by
Eldredge Teresa H
Current Estimated Value
Purchase Details
Closed on
Jan 29, 2019
Sold by
Lyko Helga
Bought by
Eldredge Teresa H and Case Carol
Home Financials for this Owner
Home Financials are based on the most recent Mortgage that was taken out on this home.
Original Mortgage
$90,000
Interest Rate
4.5%
Mortgage Type
New Conventional
Purchase Details
Closed on
Apr 30, 2004
Sold by
Dye Brian
Bought by
Lyko Erdman J and Lyko Helga
Purchase Details
Closed on
Jul 16, 2002
Sold by
Thomas Mark
Bought by
Dye Brian
Purchase Details
Closed on
Apr 10, 2000
Sold by
Patterson Bruce
Bought by
Thomas Mark
Purchase Details
Closed on
Dec 31, 1986
Bought by
Patterson Bruce
Create a Home Valuation Report for This Property
The Home Valuation Report is an in-depth analysis detailing your home's value as well as a comparison with similar homes in the area
Home Values in the Area
Average Home Value in this Area
Purchase History
| Date | Buyer | Sale Price | Title Company |
|---|---|---|---|
| Eldredge Teresa H | -- | -- | |
| Eldredge Teresa H | $190,000 | -- | |
| Lyko Erdman J | $110,000 | -- | |
| Dye Brian | $30,700 | -- | |
| Thomas Mark | $20,600 | -- | |
| Patterson Bruce | $1,000 | -- |
Source: Public Records
Mortgage History
| Date | Status | Borrower | Loan Amount |
|---|---|---|---|
| Previous Owner | Eldredge Teresa H | $90,000 |
Source: Public Records
Tax History Compared to Growth
Tax History
| Year | Tax Paid | Tax Assessment Tax Assessment Total Assessment is a certain percentage of the fair market value that is determined by local assessors to be the total taxable value of land and additions on the property. | Land | Improvement |
|---|---|---|---|---|
| 2024 | $1,046 | $114,108 | $23,250 | $90,858 |
| 2023 | $981 | $96,192 | $23,250 | $72,942 |
| 2022 | $990 | $97,090 | $23,250 | $73,840 |
| 2021 | $939 | $66,968 | $23,250 | $43,718 |
| 2020 | $906 | $63,545 | $19,827 | $43,718 |
| 2019 | $533 | $53,340 | $9,622 | $43,718 |
| 2018 | $565 | $53,340 | $9,622 | $43,718 |
| 2017 | $900 | $50,871 | $6,171 | $44,700 |
| 2016 | $105 | $6,171 | $6,171 | $0 |
| 2015 | $110 | $6,171 | $6,171 | $0 |
| 2014 | $160 | $9,016 | $9,016 | $0 |
| 2013 | -- | $9,016 | $9,016 | $0 |
Source: Public Records
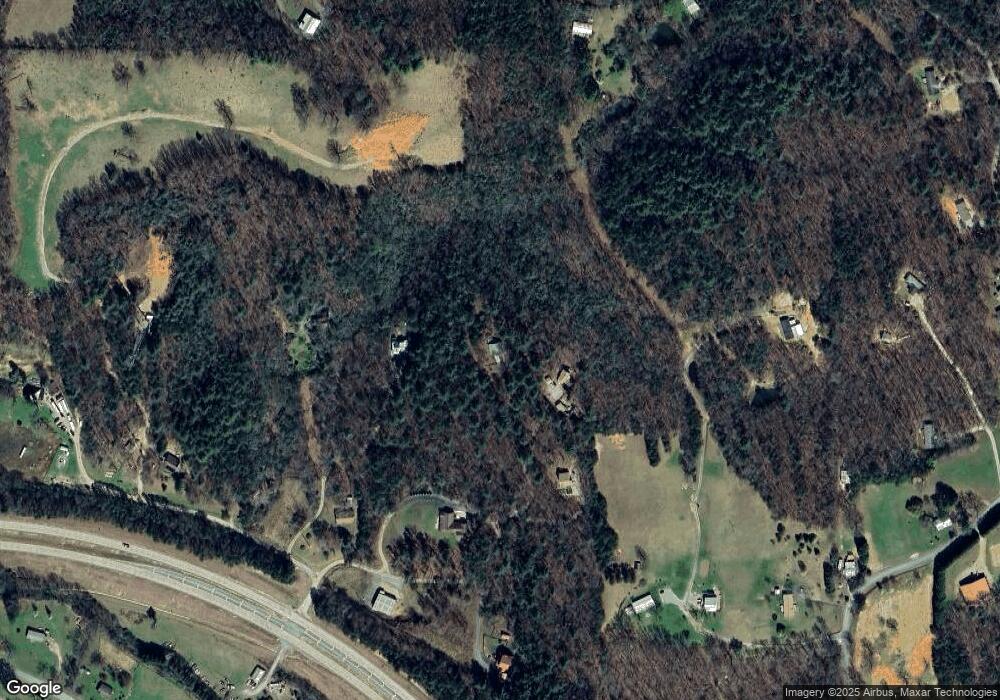
Map
Nearby Homes
- 194 Squirrel Chase
- 5240 Squirrel Hunting Rd
- 95 Upper Ridge Trail
- Lot 39 Big Valley Overlook
- 261 Big Valley Dr
- LOT 22 Lower Ridge Trail
- 162 Big Valley Dr
- TBD Alex Way
- LOT 16, (PARCEL Big Valley Dr
- 33 Carley Dr
- Lot 13 High Meadows Trail
- 249 Richlen Ridge Rd
- 357 Wise Rd
- lot 4 Mountain Meadows Dr
- 14747 Appalachian Hwy
- 305 Kimbolton Dr
- 46 Turning Lay Creek Rd
- 232 Turning Lay Rd
- 50 Turning Lay Creek Rd
- 45 Turning Lay Rd
- 90 Turning Lay Creek Rd
- 17 Turning Lay Rd
- 48 Turning Lay Creek Rd
- 48 Turning Lay Creek Rd
- 45 Turning Lay Creek Rd
- 0 Turning Lay Creek Rd Unit 299587
- 0 Turning Lay Creek Rd Unit 262332
- 0 Turning Lay Creek Rd Unit 236999
- 0 Turning Lay Creek Rd Unit 8696947
- 0 Turning Lay Creek Rd Unit 8797521
- 0 Turning Lay Creek Rd Unit Lot 10 8838279
- 150 Turning Lay Creek Rd
- 150 Turning Lay Creek Rd
- 110 Turning Lay Creek Rd
- 282 Turning Lay Creek Rd
- 427 Liberty Hill Rd