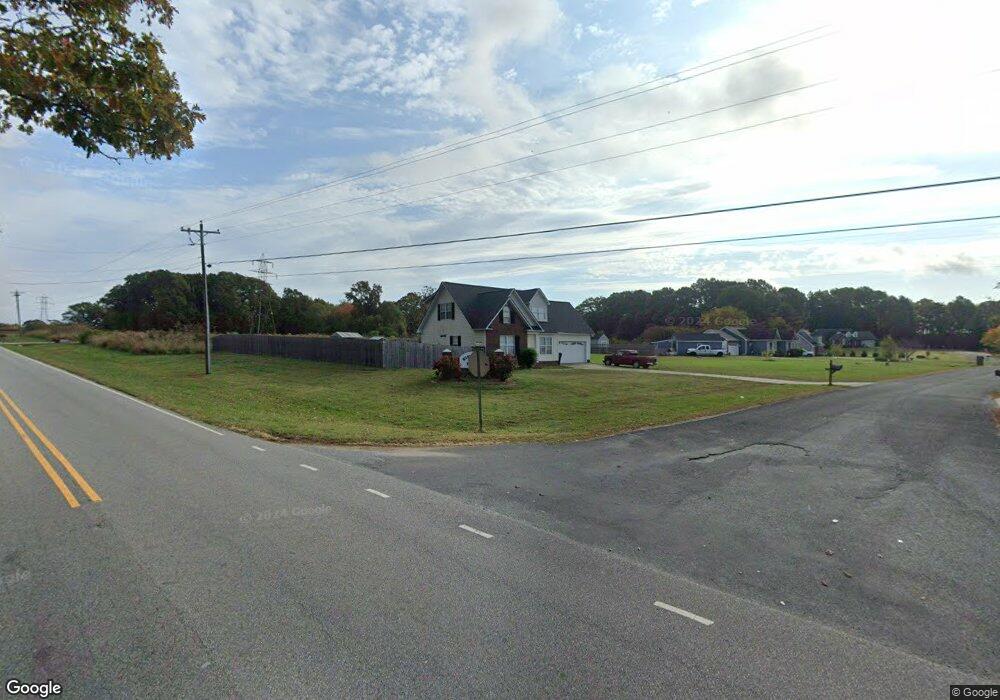
2820 Tara Dr Monroe, NC 28112
Estimated Value: $379,952 - $435,000
4
Beds
3
Baths
1,799
Sq Ft
$222/Sq Ft
Est. Value
About This Home
This home is located at 2820 Tara Dr, Monroe, NC 28112 and is currently estimated at $399,488, approximately $222 per square foot. 2820 Tara Dr is a home located in Union County with nearby schools including Prospect Elementary School, Parkwood Middle School, and Parkwood High School.
Ownership History
Date
Name
Owned For
Owner Type
Purchase Details
Closed on
Mar 9, 2004
Sold by
Mullis Melissa A and Hines Melissa
Bought by
Hines Cory and Hines Melissa
Current Estimated Value
Home Financials for this Owner
Home Financials are based on the most recent Mortgage that was taken out on this home.
Original Mortgage
$129,562
Outstanding Balance
$56,233
Interest Rate
4.87%
Mortgage Type
New Conventional
Estimated Equity
$343,255
Purchase Details
Closed on
Nov 27, 2002
Sold by
Pate Walter C and Pate Ginger M
Bought by
Mullis Melissa A
Home Financials for this Owner
Home Financials are based on the most recent Mortgage that was taken out on this home.
Original Mortgage
$108,000
Interest Rate
6.15%
Purchase Details
Closed on
Jan 24, 2000
Sold by
Ronnie Laney Const Co Inc
Bought by
Pate Walter C and Pate Ginger M
Home Financials for this Owner
Home Financials are based on the most recent Mortgage that was taken out on this home.
Original Mortgage
$134,888
Interest Rate
8.21%
Mortgage Type
FHA
Create a Home Valuation Report for This Property
The Home Valuation Report is an in-depth analysis detailing your home's value as well as a comparison with similar homes in the area
Purchase History
| Date | Buyer | Sale Price | Title Company |
|---|---|---|---|
| Hines Cory | -- | -- | |
| Mullis Melissa A | $135,000 | -- | |
| Pate Walter C | $136,000 | -- |
Source: Public Records
Mortgage History
| Date | Status | Borrower | Loan Amount |
|---|---|---|---|
| Open | Hines Cory | $129,562 | |
| Closed | Mullis Melissa A | $108,000 | |
| Previous Owner | Pate Walter C | $134,888 | |
| Closed | Mullis Melissa A | $20,236 |
Source: Public Records
Tax History
| Year | Tax Paid | Tax Assessment Tax Assessment Total Assessment is a certain percentage of the fair market value that is determined by local assessors to be the total taxable value of land and additions on the property. | Land | Improvement |
|---|---|---|---|---|
| 2025 | $1,557 | $323,300 | $0 | $0 |
| 2024 | $1,409 | $219,100 | $27,700 | $191,400 |
| 2023 | $1,390 | $219,100 | $27,700 | $191,400 |
| 2022 | $1,390 | $219,100 | $27,700 | $191,400 |
| 2021 | $1,381 | $219,100 | $27,700 | $191,400 |
| 2020 | $1,291 | $167,430 | $15,830 | $151,600 |
| 2019 | $1,316 | $167,430 | $15,830 | $151,600 |
| 2018 | $1,316 | $167,430 | $15,830 | $151,600 |
| 2017 | $1,402 | $167,400 | $15,800 | $151,600 |
| 2016 | $1,356 | $167,430 | $15,830 | $151,600 |
| 2015 | $1,379 | $167,430 | $15,830 | $151,600 |
| 2014 | $1,156 | $166,030 | $34,390 | $131,640 |
Source: Public Records
Map
Nearby Homes
- 5200 Lancaster Hwy
- 2721 Tara Dr
- 5916 Griffith Rd
- 3605 Crow Rd
- 3624 Crow Rd
- 4114 Mcmanus Rd Unit 1
- 4120 Mcmanus Rd
- 5124 Pond Bluff Dr
- 2504 Long Hope Rd
- 4607 Nesbit Rd
- 6404 Lancaster Hwy
- 2720 Yellow Bell Way
- 5313 Old Highway Rd
- 3711 Roughedge Dr
- 00 Crow Rd
- 3710 Roughedge Dr
- 3707 Roughedge Dr
- 2005 Trey Ct
- 3706 Roughedge Dr
- 3504 Oasis Dr
- 2816 Tara Dr
- 2901 Ashley Woods Ct
- 2817 Tara Dr
- 2900 Ashley Woods Ct
- 5021 Lancaster Hwy
- 5021 Lancaster Hwy Unit 2
- 5017 Lancaster Hwy Unit 1
- 5017 Lancaster Hwy
- MULTI Lancaster Hwy Unit Lots 1,2,3,4,5 & 6
- 2810 Tara Dr
- 2813 Tara Dr
- 5116 Lancaster Hwy Unit 3
- 5116 Lancaster Hwy Unit Lot 3
- 2904 Ashley Woods Ct
- 5019 Lancaster Hwy Unit 3
- 4917 Lancaster Hwy
- 5016 Lancaster Hwy
- 5120 Lancaster Hwy
- 2809 Tara Dr
- 2802 Tara Dr
Your Personal Tour Guide
Ask me questions while you tour the home.