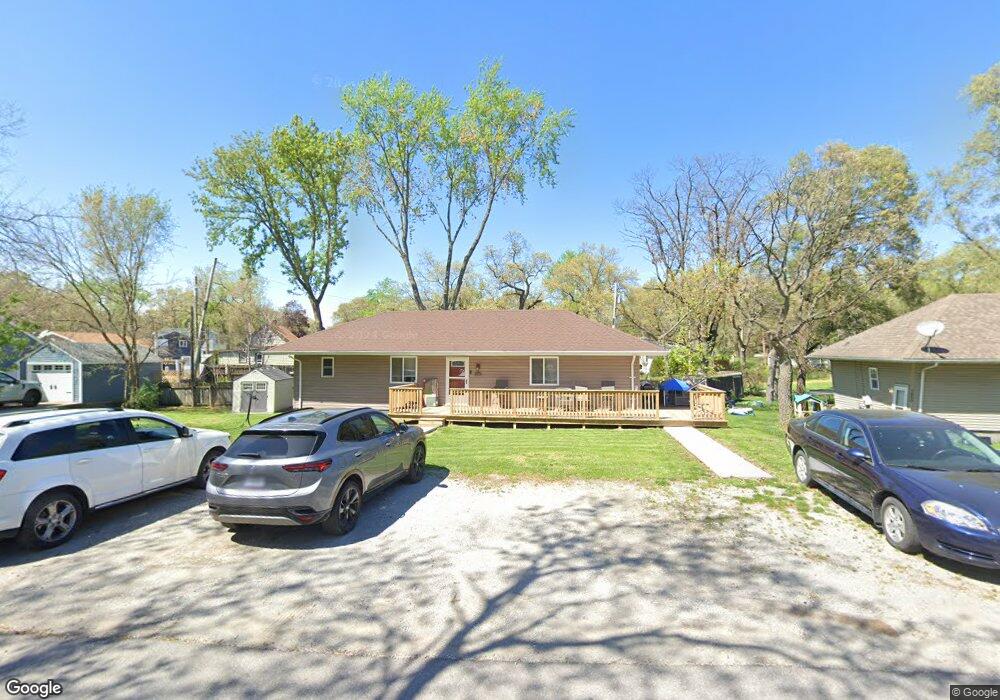
2820 W 40th Place Gary, IN 46408
Ross NeighborhoodEstimated Value: $114,000 - $170,000
3
Beds
1
Bath
1,000
Sq Ft
$141/Sq Ft
Est. Value
About This Home
This home is located at 2820 W 40th Place, Gary, IN 46408 and is currently estimated at $140,520, approximately $140 per square foot. 2820 W 40th Place is a home located in Lake County with nearby schools including Calumet High School, Steel City Academy, and Ambassador Academy.
Ownership History
Date
Name
Owned For
Owner Type
Purchase Details
Closed on
Jun 2, 2020
Sold by
Beeler Judith A
Bought by
Stroud Michele M
Current Estimated Value
Purchase Details
Closed on
Sep 18, 2019
Sold by
Beeler Allen W and Beeler Judith A
Bought by
Beeler Judith A
Purchase Details
Closed on
Jun 22, 2016
Sold by
Beeler Allen W and Beeler Judith A
Bought by
Beeler Judith A
Purchase Details
Closed on
Apr 7, 2016
Sold by
Beeler Allen W and Beeler Judith A
Bought by
Beeler Judith A
Purchase Details
Closed on
Apr 27, 2010
Sold by
Peoples Bank Fsb
Bought by
Beeler Allen W and Beeler Judith A
Purchase Details
Closed on
Sep 1, 2006
Sold by
Walsh William A
Bought by
Nwi Acquisitions Llc
Create a Home Valuation Report for This Property
The Home Valuation Report is an in-depth analysis detailing your home's value as well as a comparison with similar homes in the area
Home Values in the Area
Average Home Value in this Area
Purchase History
| Date | Buyer | Sale Price | Title Company |
|---|---|---|---|
| Stroud Michele M | -- | None Available | |
| Beeler Judith A | -- | None Available | |
| Beeler Judith A | -- | None Available | |
| Beeler Judith A | -- | None Available | |
| Beeler Allen W | -- | Ticor Cp | |
| Nwi Acquisitions Llc | $85,904 | None Available |
Source: Public Records
Tax History Compared to Growth
Tax History
| Year | Tax Paid | Tax Assessment Tax Assessment Total Assessment is a certain percentage of the fair market value that is determined by local assessors to be the total taxable value of land and additions on the property. | Land | Improvement |
|---|---|---|---|---|
| 2024 | $2,211 | $53,200 | $12,300 | $40,900 |
| 2023 | $517 | $51,900 | $12,300 | $39,600 |
| 2022 | $517 | $51,100 | $12,200 | $38,900 |
| 2021 | $473 | $47,800 | $12,200 | $35,600 |
| 2020 | $0 | $47,500 | $12,200 | $35,300 |
| 2019 | $85 | $46,700 | $11,800 | $34,900 |
| 2018 | $85 | $42,700 | $11,200 | $31,500 |
| 2017 | $85 | $41,500 | $10,900 | $30,600 |
| 2016 | $85 | $40,500 | $10,300 | $30,200 |
| 2014 | $17 | $49,400 | $12,400 | $37,000 |
| 2013 | $5 | $48,000 | $12,400 | $35,600 |
Source: Public Records
Map
Nearby Homes
- 3044 W Ridge Rd Unit Rear
- 2345 Ranburn Dr
- 4300 Roosevelt Place
- 3847 Taft St
- 2100 Crest Rd
- 4056 Cleveland St
- 4401 W Taft St
- 3725 Cleveland St
- 3701 Grant St
- 3521-23 W 47th Ave
- 4381 Richard Gordon Hatcher Blvd
- 3816 Lincoln St
- 4695 Whitcomb St
- 4673 Arthur St
- 1977 W 47th Ave
- 3512 W 48th Ct
- 3654 Buchanan St
- 3642 Buchanan St
- 4645 Hayes St
- 4034 Fillmore St
- 2817 Beverly Dr
- 2832 W 40th Place
- 2800 W 40th Place
- 2900 W 40th Place
- 2825 Beverly Dr
- 2825 W 40th Place
- 2910 W 40th Place
- 2833 W 40th Place
- 4008 Marshall Place
- 2909 W 40th Ave
- 2832 Beverly Dr
- 4000 Marshall Place
- 4062 Marshall Place
- 2925 W 40th Ave
- 2840 Beverly Dr
- 4058 Marshall Place
- 4058 Marshall Place
- 2916 W 40th Place
- 2733 Beverly Dr
- 2733 Beverly Dr