28201 Montecito Unit 57 Laguna Niguel, CA 92677
Colinas de Capistrano NeighborhoodEstimated Value: $593,000 - $626,000
2
Beds
1
Bath
796
Sq Ft
$765/Sq Ft
Est. Value
About This Home
This home is located at 28201 Montecito Unit 57, Laguna Niguel, CA 92677 and is currently estimated at $608,804, approximately $764 per square foot. 28201 Montecito Unit 57 is a home located in Orange County with nearby schools including Hidden Hills Elementary, Niguel Hills Middle School, and Dana Hills High School.
Ownership History
Date
Name
Owned For
Owner Type
Purchase Details
Closed on
May 5, 2005
Sold by
Eusebi Mayte
Bought by
Ramirez Cynthia
Current Estimated Value
Home Financials for this Owner
Home Financials are based on the most recent Mortgage that was taken out on this home.
Original Mortgage
$280,000
Outstanding Balance
$145,149
Interest Rate
5.75%
Mortgage Type
Purchase Money Mortgage
Estimated Equity
$463,655
Purchase Details
Closed on
Jan 22, 2001
Sold by
Maddaloni Andrea
Bought by
Eusebi Mayte
Home Financials for this Owner
Home Financials are based on the most recent Mortgage that was taken out on this home.
Original Mortgage
$100,000
Interest Rate
7.41%
Purchase Details
Closed on
May 9, 1994
Sold by
Riley Carol A
Bought by
Eusebi Mayte and Maddaloni Andrea
Home Financials for this Owner
Home Financials are based on the most recent Mortgage that was taken out on this home.
Original Mortgage
$70,400
Interest Rate
8.83%
Create a Home Valuation Report for This Property
The Home Valuation Report is an in-depth analysis detailing your home's value as well as a comparison with similar homes in the area
Home Values in the Area
Average Home Value in this Area
Purchase History
| Date | Buyer | Sale Price | Title Company |
|---|---|---|---|
| Ramirez Cynthia | $350,000 | Ticor Title | |
| Eusebi Mayte | -- | Commonwealth Land Title | |
| Eusebi Mayte | $88,000 | First American Title Ins Co |
Source: Public Records
Mortgage History
| Date | Status | Borrower | Loan Amount |
|---|---|---|---|
| Open | Ramirez Cynthia | $280,000 | |
| Previous Owner | Eusebi Mayte | $100,000 | |
| Previous Owner | Eusebi Mayte | $70,400 |
Source: Public Records
Tax History Compared to Growth
Tax History
| Year | Tax Paid | Tax Assessment Tax Assessment Total Assessment is a certain percentage of the fair market value that is determined by local assessors to be the total taxable value of land and additions on the property. | Land | Improvement |
|---|---|---|---|---|
| 2025 | $4,783 | $487,860 | $369,237 | $118,623 |
| 2024 | $4,783 | $478,295 | $361,997 | $116,298 |
| 2023 | $4,680 | $468,917 | $354,899 | $114,018 |
| 2022 | $3,954 | $396,780 | $304,657 | $92,123 |
| 2021 | $3,877 | $389,000 | $298,683 | $90,317 |
| 2020 | $3,657 | $367,200 | $276,883 | $90,317 |
| 2019 | $3,584 | $360,000 | $271,453 | $88,547 |
| 2018 | $3,282 | $330,000 | $241,453 | $88,547 |
| 2017 | $3,282 | $330,000 | $241,453 | $88,547 |
| 2016 | $3,101 | $312,000 | $223,453 | $88,547 |
| 2015 | $3,101 | $312,000 | $223,453 | $88,547 |
| 2014 | $2,703 | $272,600 | $184,053 | $88,547 |
Source: Public Records
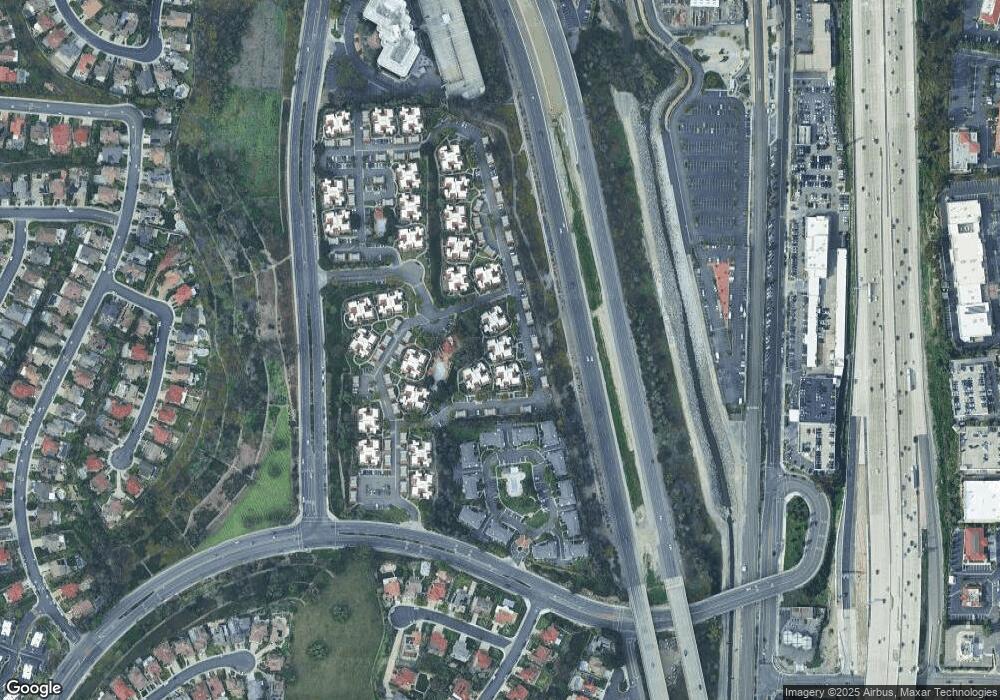
Map
Nearby Homes
- 25961 Montemar Unit 67
- 28151 Montecito Unit 36
- 28201 Sorrento Unit 115
- 28215 Paseo el Siena Unit 46
- 28305 Paseo el Siena Unit 10
- 28121 Montecito Unit 21
- 28422 La Pradera
- 28435 La Pradera
- 28381 La Pradera
- 28682 Avenida Del Caballo
- 28705 Charreadas
- 25641 Paseo la Cresta
- 25625 Paseo la Cresta Unit 39
- 25552 Paseo la Vista Unit 20
- 28721 Placida Ave
- 25246 San Michele
- 25081 Leucadia St Unit F
- 25072 Leucadia St Unit E
- 29282 Rue Cerise Unit 7
- 25071 Calle Playa Unit H
- 28201 Montecito Unit 60
- 28201 Montecito Unit 59
- 28201 Montecito Unit 60
- 28201 Montecito Unit 64
- 28201 Montecito Unit 62
- 28201 Montecito Unit 58
- 28201 Montecito Unit 61
- 28201 Montecito Unit 63
- 28201 Montecito Unit 39
- 25961 Montemar Unit 69
- 25961 Montemar
- 25961 Montemar Unit 66
- 25961 Montemar Unit 69
- 25961 Montemar Unit 71
- 25961 Montemar Unit 72
- 25961 Montemar Unit 65
- 25961 Montemar Unit 70
- 25961 Montemar Unit 68
- 28181 Montecito Unit 56
- 28181 Montecito Unit 49