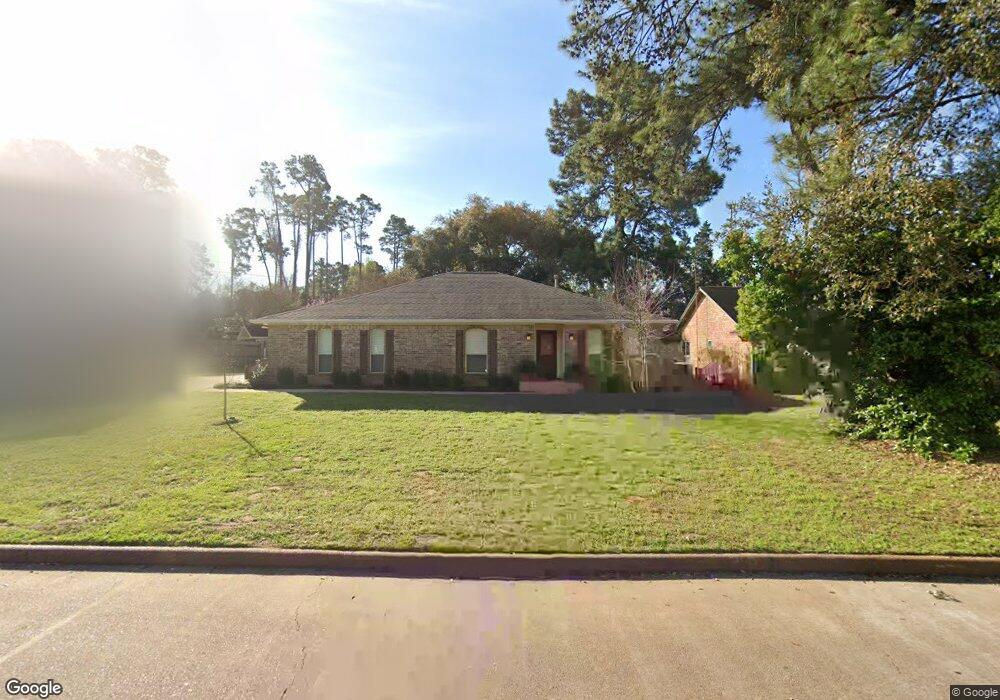
28202 Heidi Ln Tomball, TX 77375
Estimated Value: $283,939 - $316,000
3
Beds
2
Baths
1,737
Sq Ft
$173/Sq Ft
Est. Value
About This Home
This home is located at 28202 Heidi Ln, Tomball, TX 77375 and is currently estimated at $301,235, approximately $173 per square foot. 28202 Heidi Ln is a home located in Harris County with nearby schools including Tomball Elementary School, Tomball Intermediate School, and Tomball Junior High School.
Ownership History
Date
Name
Owned For
Owner Type
Purchase Details
Closed on
Feb 12, 2015
Sold by
Smith Matthew
Bought by
Arrant Sandra
Current Estimated Value
Purchase Details
Closed on
May 3, 2013
Sold by
Smith Philip G and Smith Phillip George
Bought by
Smith Matthew
Home Financials for this Owner
Home Financials are based on the most recent Mortgage that was taken out on this home.
Original Mortgage
$88,369
Interest Rate
3.75%
Mortgage Type
FHA
Purchase Details
Closed on
Jun 15, 2004
Sold by
Hrobar Shirley M
Bought by
Smith Philip G and Smith Audrey M
Home Financials for this Owner
Home Financials are based on the most recent Mortgage that was taken out on this home.
Original Mortgage
$115,900
Interest Rate
3.37%
Mortgage Type
Unknown
Create a Home Valuation Report for This Property
The Home Valuation Report is an in-depth analysis detailing your home's value as well as a comparison with similar homes in the area
Home Values in the Area
Average Home Value in this Area
Purchase History
| Date | Buyer | Sale Price | Title Company |
|---|---|---|---|
| Arrant Sandra | -- | Stewart Title | |
| Smith Matthew | -- | Stewart Title | |
| Smith Philip G | -- | Alamo Title Company |
Source: Public Records
Mortgage History
| Date | Status | Borrower | Loan Amount |
|---|---|---|---|
| Previous Owner | Smith Matthew | $88,369 | |
| Previous Owner | Smith Philip G | $115,900 |
Source: Public Records
Tax History Compared to Growth
Tax History
| Year | Tax Paid | Tax Assessment Tax Assessment Total Assessment is a certain percentage of the fair market value that is determined by local assessors to be the total taxable value of land and additions on the property. | Land | Improvement |
|---|---|---|---|---|
| 2025 | $1,237 | $280,325 | $52,918 | $227,407 |
| 2024 | $1,237 | $277,952 | $52,918 | $225,034 |
| 2023 | $1,237 | $271,424 | $50,842 | $220,582 |
| 2022 | $4,536 | $238,423 | $47,730 | $190,693 |
| 2021 | $4,339 | $182,942 | $38,910 | $144,032 |
| 2020 | $4,464 | $182,024 | $33,722 | $148,302 |
| 2019 | $4,255 | $186,045 | $25,940 | $160,105 |
| 2018 | $1,720 | $153,344 | $23,865 | $129,479 |
| 2017 | $3,864 | $153,344 | $23,865 | $129,479 |
| 2016 | $3,864 | $153,344 | $23,865 | $129,479 |
| 2015 | $866 | $138,415 | $23,865 | $114,550 |
| 2014 | $866 | $138,415 | $23,865 | $114,550 |
Source: Public Records
Map
Nearby Homes
- 14222 Spring Pines Dr
- 28102 Linda Ln
- 14210 Altair Dr
- 14123 Spring Pines Dr
- 31318 Bearing Star Ln
- 31335 Bearing Star Ln
- 14134 Pollux Ct
- 31407 Bearing Star Ln
- 14219 Turnervine Dr
- 31410 Bearing Star Ln
- 11211 Stirton Dr
- 11235 Stirton Dr
- 14906 Quaking Aspen Dr
- 14915 Shingle Oak Dr
- 1319 Pine Trail
- 0 Keen Rd
- 14911 Quaking Aspen Dr
- 1310 Big Pines
- 1315 Big Pines
- 1302 Pine Trail
- 28118 Heidi Ln
- 28206 Heidi Ln
- 28210 Heidi Ln
- 31106 Antonia Ln
- 28214 Heidi Ln
- 31110 Antonia Ln
- 31103 Alice Ln
- 28218 Heidi Ln
- 30310 State Highway 249
- 30310b Texas 249
- 31114 Antonia Ln
- 31102 Alice Ln
- 31118 Antonia Ln
- 31119 Antonia Ln
- 31106 Alice Ln
- 0 Limerick
- 30218 State Highway 249
- 31102 Stella Ln
- 31102 Stella Ln Unit A
- 31102 Stella Ln Unit A