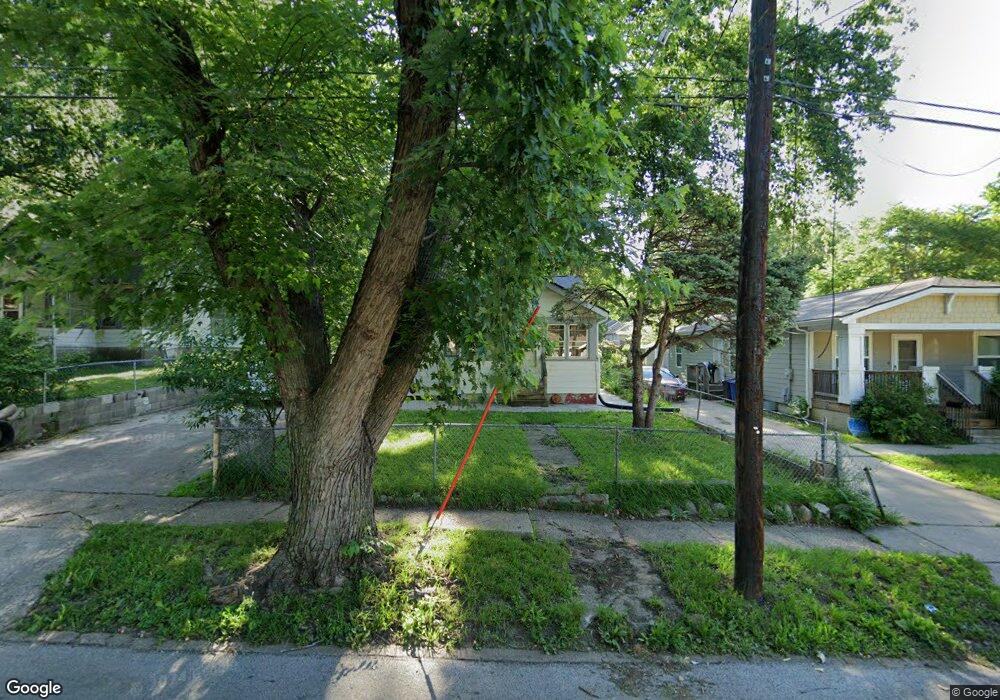
2821 1st St Des Moines, IA 50313
Union Park NeighborhoodEstimated Value: $101,000 - $118,000
2
Beds
1
Bath
616
Sq Ft
$175/Sq Ft
Est. Value
About This Home
This home is located at 2821 1st St, Des Moines, IA 50313 and is currently estimated at $107,873, approximately $175 per square foot. 2821 1st St is a home located in Polk County with nearby schools including Findley Elementary School, Harding Middle School, and North High School.
Ownership History
Date
Name
Owned For
Owner Type
Purchase Details
Closed on
Dec 16, 2021
Sold by
Fernandez Nancy and Estate Of Segundo C Guaman
Bought by
Guaman Oscar and Segovia Juan
Current Estimated Value
Home Financials for this Owner
Home Financials are based on the most recent Mortgage that was taken out on this home.
Original Mortgage
$64,000
Outstanding Balance
$58,863
Interest Rate
3.11%
Mortgage Type
New Conventional
Estimated Equity
$49,010
Purchase Details
Closed on
Feb 8, 2010
Sold by
The Secretary Of Housing & Urban Develop
Bought by
Guaman Segundo Carlos
Purchase Details
Closed on
Mar 12, 2009
Sold by
Grother Anthony and Hageman Andrea
Bought by
Chase Home Finance Llc
Purchase Details
Closed on
Dec 5, 2007
Sold by
Ia Realty Net Llc
Bought by
Grother Anthony and Hageman Andrea
Home Financials for this Owner
Home Financials are based on the most recent Mortgage that was taken out on this home.
Original Mortgage
$66,457
Interest Rate
6.13%
Mortgage Type
FHA
Purchase Details
Closed on
Aug 24, 2007
Sold by
Morequity Inc
Bought by
Iarealtynet Llc
Home Financials for this Owner
Home Financials are based on the most recent Mortgage that was taken out on this home.
Original Mortgage
$47,000
Interest Rate
6.33%
Mortgage Type
Purchase Money Mortgage
Purchase Details
Closed on
Apr 19, 2007
Sold by
Grover Ronald L and Grover Kathy A
Bought by
Morequity Inc
Purchase Details
Closed on
Oct 2, 2002
Sold by
Creative Homes Inc
Bought by
Grover Ronald L and Grover Kathy A
Home Financials for this Owner
Home Financials are based on the most recent Mortgage that was taken out on this home.
Original Mortgage
$66,500
Interest Rate
8.5%
Purchase Details
Closed on
Jun 6, 2001
Sold by
Creative Homes Inc
Bought by
Grover Ronald L and Grover Kathy A
Home Financials for this Owner
Home Financials are based on the most recent Mortgage that was taken out on this home.
Original Mortgage
$60,625
Interest Rate
9.75%
Mortgage Type
Seller Take Back
Purchase Details
Closed on
Apr 12, 2001
Sold by
Cox Pearl and Cox Pearl M
Bought by
Creative Homes Inc
Home Financials for this Owner
Home Financials are based on the most recent Mortgage that was taken out on this home.
Original Mortgage
$60,625
Interest Rate
9.75%
Mortgage Type
Seller Take Back
Create a Home Valuation Report for This Property
The Home Valuation Report is an in-depth analysis detailing your home's value as well as a comparison with similar homes in the area
Home Values in the Area
Average Home Value in this Area
Purchase History
| Date | Buyer | Sale Price | Title Company |
|---|---|---|---|
| Guaman Oscar | $80,000 | None Available | |
| Guaman Segundo Carlos | -- | None Available | |
| Chase Home Finance Llc | $50,000 | None Available | |
| Grother Anthony | $67,000 | None Available | |
| Iarealtynet Llc | $39,500 | None Available | |
| Morequity Inc | $42,500 | None Available | |
| Grover Ronald L | $62,000 | -- | |
| Grover Ronald L | $62,500 | -- | |
| Creative Homes Inc | $40,500 | -- |
Source: Public Records
Mortgage History
| Date | Status | Borrower | Loan Amount |
|---|---|---|---|
| Open | Guaman Oscar | $64,000 | |
| Previous Owner | Grother Anthony | $66,457 | |
| Previous Owner | Iarealtynet Llc | $47,000 | |
| Previous Owner | Grover Ronald L | $66,500 | |
| Previous Owner | Grover Ronald L | $60,625 | |
| Previous Owner | Creative Homes Inc | $50,000 |
Source: Public Records
Tax History Compared to Growth
Tax History
| Year | Tax Paid | Tax Assessment Tax Assessment Total Assessment is a certain percentage of the fair market value that is determined by local assessors to be the total taxable value of land and additions on the property. | Land | Improvement |
|---|---|---|---|---|
| 2025 | $1,472 | $87,000 | $21,200 | $65,800 |
| 2024 | $1,472 | $74,800 | $18,200 | $56,600 |
| 2023 | $1,502 | $74,800 | $18,200 | $56,600 |
| 2022 | $1,490 | $63,700 | $15,900 | $47,800 |
| 2021 | $1,382 | $63,700 | $15,900 | $47,800 |
| 2020 | $1,436 | $55,400 | $13,900 | $41,500 |
| 2019 | $1,304 | $55,400 | $13,900 | $41,500 |
| 2018 | $1,290 | $48,500 | $12,000 | $36,500 |
| 2017 | $1,288 | $48,500 | $12,000 | $36,500 |
| 2016 | $1,254 | $47,600 | $11,800 | $35,800 |
| 2015 | $1,254 | $47,600 | $11,800 | $35,800 |
| 2014 | $1,370 | $53,500 | $13,100 | $40,400 |
Source: Public Records
Map
Nearby Homes