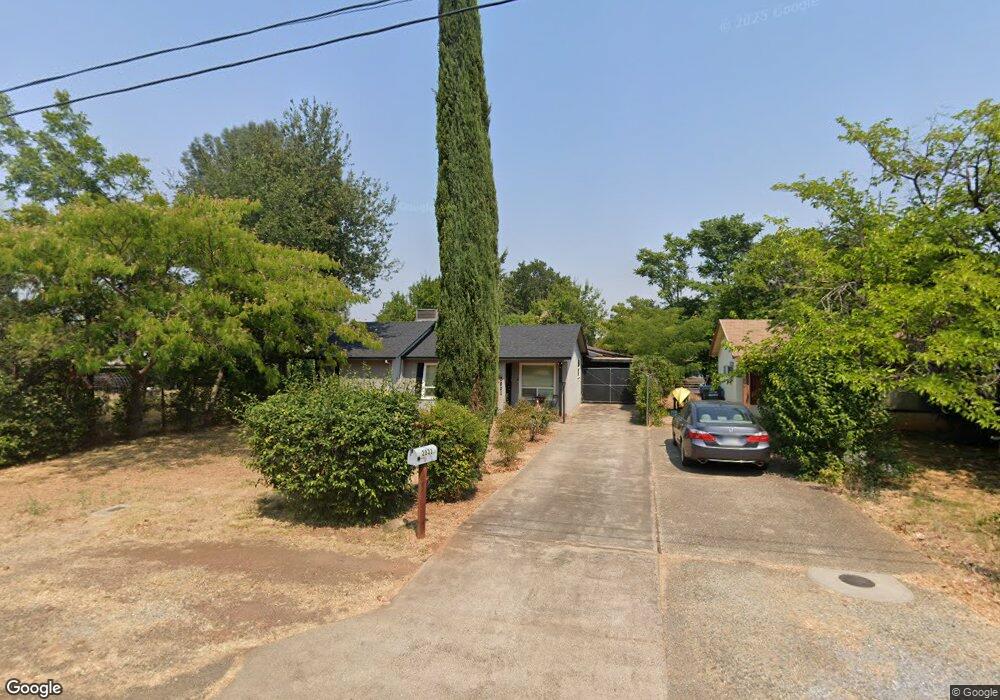
2821 Blue View St Redding, CA 96002
Estimated Value: $218,000 - $226,000
2
Beds
1
Bath
884
Sq Ft
$253/Sq Ft
Est. Value
About This Home
This home is located at 2821 Blue View St, Redding, CA 96002 and is currently estimated at $223,302, approximately $252 per square foot. 2821 Blue View St is a home located in Shasta County with nearby schools including Rother Elementary School, Parsons Junior High School, and Enterprise High School.
Ownership History
Date
Name
Owned For
Owner Type
Purchase Details
Closed on
Jan 18, 2019
Sold by
Robbins Walter G and Robbins Lugene
Bought by
Robbins Walter G and Robbins Lugene
Current Estimated Value
Purchase Details
Closed on
Oct 3, 2016
Sold by
Robbins Charles
Bought by
Robbins Walter G and Robbins Lugene
Purchase Details
Closed on
May 19, 2010
Sold by
Searson Laurie
Bought by
Robbins Charles
Purchase Details
Closed on
Oct 14, 2002
Sold by
Searson Allison
Bought by
Searson Laurie
Purchase Details
Closed on
Apr 10, 1998
Sold by
Petersen Burton L and Petersen Isabelle M
Bought by
Searson Allison
Home Financials for this Owner
Home Financials are based on the most recent Mortgage that was taken out on this home.
Original Mortgage
$52,200
Interest Rate
7.18%
Mortgage Type
Seller Take Back
Create a Home Valuation Report for This Property
The Home Valuation Report is an in-depth analysis detailing your home's value as well as a comparison with similar homes in the area
Purchase History
| Date | Buyer | Sale Price | Title Company |
|---|---|---|---|
| Robbins Walter G | -- | None Available | |
| Robbins Walter G | $10,000 | Placer Title Company | |
| Robbins Charles | $102,000 | Fidelity Natl Title Co Of Ca | |
| Searson Laurie | -- | Fidelity Natl Title Co Of Ca | |
| Searson Allison | $65,000 | Fidelity National Title Co |
Source: Public Records
Mortgage History
| Date | Status | Borrower | Loan Amount |
|---|---|---|---|
| Previous Owner | Searson Allison | $52,200 |
Source: Public Records
Tax History
| Year | Tax Paid | Tax Assessment Tax Assessment Total Assessment is a certain percentage of the fair market value that is determined by local assessors to be the total taxable value of land and additions on the property. | Land | Improvement |
|---|---|---|---|---|
| 2025 | $1,473 | $133,461 | $46,420 | $87,041 |
| 2024 | $1,452 | $130,845 | $45,510 | $85,335 |
| 2023 | $1,452 | $128,280 | $44,618 | $83,662 |
| 2022 | $1,411 | $125,766 | $43,744 | $82,022 |
| 2021 | $1,363 | $123,301 | $42,887 | $80,414 |
| 2020 | $1,356 | $122,038 | $42,448 | $79,590 |
| 2019 | $1,345 | $119,646 | $41,616 | $78,030 |
| 2018 | $1,330 | $117,300 | $40,800 | $76,500 |
| 2017 | $1,353 | $115,000 | $40,000 | $75,000 |
| 2016 | $1,173 | $111,217 | $38,162 | $73,055 |
| 2015 | $1,162 | $109,547 | $37,589 | $71,958 |
| 2014 | $1,014 | $95,000 | $30,000 | $65,000 |
Source: Public Records
Map
Nearby Homes
- 0 Churn Creek Rd Unit 25-496
- 0 Churn Creek Rd Unit 26-609
- 890 Parsons Dr
- 3087 Northwoods Way
- 2820 Alfreda Way
- 2893 Alfreda Way
- 2631 Alfreda Way
- 2855 Irwin Rd
- 1075 Le Brun Ln
- 3140 C St
- 3178 Lawrence Rd
- 1091 Del Sol Place
- 2583 Reservoir Ln
- 2906 Regal Ave
- 1108 4th St
- 3527 Adams Ln
- 1005 Grissom Ct
- 3540 Ricardo Ave
- 2935 Shotwick Trail
- 3283 Middleton Ln
- 2821 Blueview St
- 2821 Blue View
- 2827 Blue View St
- 2839 Blueview St
- 2839 Blue View St
- 2818 Churn Creek Rd
- 2801 Blueview St
- 2818 2820 Churn Creek Rd
- 2841 Blue View St
- 2801 Blue View St
- 2800 Churn Creek Rd
- 2764 Blue View
- 2820 Churn Creek Rd Unit 1
- 2820 Churn Creek Rd
- 2820 Blueview St
- 2820 Blue View St
- 2818,2820 Churn Ck
- 2802 Blue View St
- 2783 Blue View St
- 2840 Blueview St
Your Personal Tour Guide
Ask me questions while you tour the home.