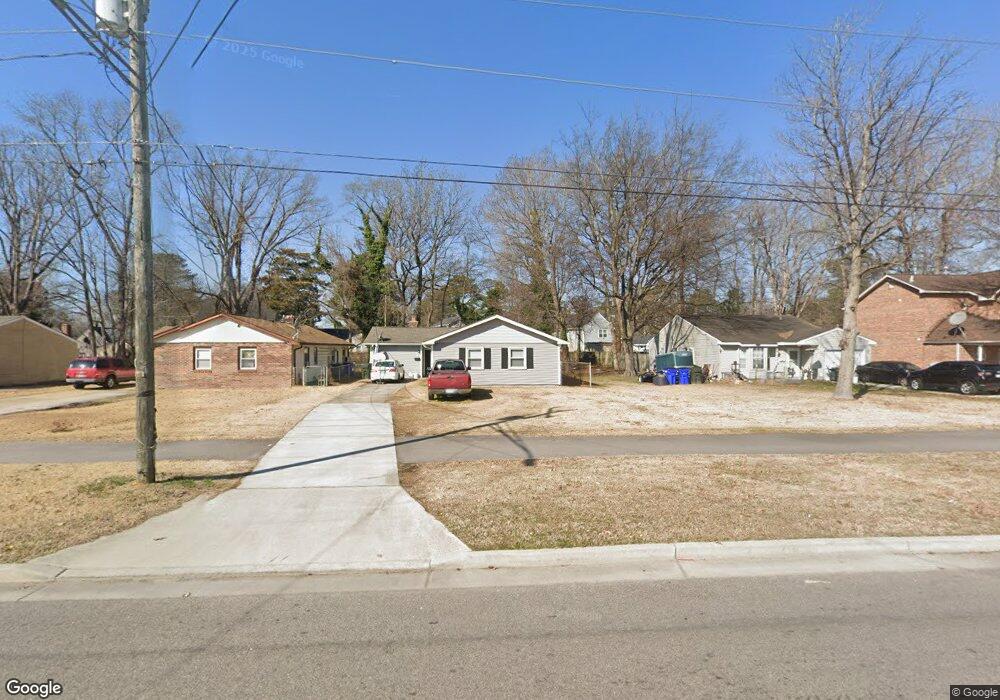
2821 Chesapeake Blvd Norfolk, VA 23509
Fairmount Park NeighborhoodEstimated Value: $262,000 - $293,851
3
Beds
2
Baths
1,428
Sq Ft
$196/Sq Ft
Est. Value
About This Home
This home is located at 2821 Chesapeake Blvd, Norfolk, VA 23509 and is currently estimated at $279,963, approximately $196 per square foot. 2821 Chesapeake Blvd is a home located in Norfolk City with nearby schools including Lindenwood Elementary School, Azalea Gardens Middle School, and Maury High School.
Ownership History
Date
Name
Owned For
Owner Type
Purchase Details
Closed on
Oct 6, 2016
Sold by
Icc Worldwide Inc A Virginia Corporation
Bought by
Fisher Johnny D and Brown Calista L
Current Estimated Value
Home Financials for this Owner
Home Financials are based on the most recent Mortgage that was taken out on this home.
Original Mortgage
$172,873
Outstanding Balance
$138,590
Interest Rate
3.46%
Mortgage Type
New Conventional
Estimated Equity
$141,373
Purchase Details
Closed on
Apr 27, 2016
Sold by
The Leticia V Colobong Living Trust Date
Bought by
Icc Worldwide Inc
Home Financials for this Owner
Home Financials are based on the most recent Mortgage that was taken out on this home.
Original Mortgage
$79,500
Interest Rate
3.58%
Mortgage Type
Future Advance Clause Open End Mortgage
Purchase Details
Closed on
Aug 7, 2006
Sold by
Colby Edward Spencer and Colobong Laticia Veneracion
Bought by
Leticia V Colobong Living Trust
Purchase Details
Closed on
Apr 4, 2006
Sold by
Colobong Leticia V
Bought by
Colobong Leticia Veneracion
Create a Home Valuation Report for This Property
The Home Valuation Report is an in-depth analysis detailing your home's value as well as a comparison with similar homes in the area
Home Values in the Area
Average Home Value in this Area
Purchase History
| Date | Buyer | Sale Price | Title Company |
|---|---|---|---|
| Fisher Johnny D | $169,900 | Attorney | |
| Icc Worldwide Inc | $57,000 | Preferred Escrow & Title Inc | |
| Leticia V Colobong Living Trust | -- | -- | |
| Colobong Leticia Veneracion | -- | -- |
Source: Public Records
Mortgage History
| Date | Status | Borrower | Loan Amount |
|---|---|---|---|
| Open | Fisher Johnny D | $172,873 | |
| Previous Owner | Icc Worldwide Inc | $79,500 |
Source: Public Records
Tax History Compared to Growth
Tax History
| Year | Tax Paid | Tax Assessment Tax Assessment Total Assessment is a certain percentage of the fair market value that is determined by local assessors to be the total taxable value of land and additions on the property. | Land | Improvement |
|---|---|---|---|---|
| 2025 | $3,236 | $258,900 | $72,200 | $186,700 |
| 2024 | $2,973 | $241,700 | $72,200 | $169,500 |
| 2023 | $2,794 | $223,500 | $72,200 | $151,300 |
| 2022 | $2,531 | $202,500 | $55,400 | $147,100 |
| 2021 | $2,334 | $186,700 | $52,800 | $133,900 |
| 2020 | $2,096 | $167,700 | $44,000 | $123,700 |
| 2019 | $2,096 | $167,700 | $44,000 | $123,700 |
| 2018 | $2,034 | $162,700 | $44,000 | $118,700 |
| 2017 | $1,872 | $162,800 | $44,000 | $118,800 |
| 2016 | $1,623 | $140,300 | $44,000 | $96,300 |
| 2015 | $1,613 | $140,300 | $44,000 | $96,300 |
| 2014 | $1,613 | $140,300 | $44,000 | $96,300 |
Source: Public Records
Map
Nearby Homes
- 2826 Lens Ave
- 2912 Verdun Ave
- 2900 Chesapeake Blvd
- 2735 Harrell Ave
- 2815 Argonne Ave
- 2949 Verdun Ave
- 2735 Keller Ave
- 2843 Davis St
- 2721 Keller Ave
- 2941 Marne Ave
- 2644 McKann Ave
- 2700 Lens Ave
- 2830 Vincent Ave
- 2630 Argonne Ave
- 2611 Harrell Ave
- 3117 Lyons Ave
- 3126 Marne Ave
- 2841 Dunkirk Ave
- 3006 Ballentine Blvd
- 2617 Gornto Ave
- 2823 Chesapeake Blvd
- 2817 Chesapeake Blvd
- 2827 Chesapeake Blvd
- 2811 Chesapeake Blvd
- 2811 Chesapeake Blvd Unit A
- 2811 Chesapeake Blvd Unit B
- 2811 Chesapeake Blvd
- 2831 Chesapeake Blvd
- 2824 Lens Ave
- 2818 Lens Ave
- 2814 Lens Ave
- 2835 Chesapeake Blvd
- 2830 Lens Ave
- 2810 Lens Ave
- 2837 Chesapeake Blvd
- 2628 Shoop Ave Unit J
- 2628 Shoop Ave Unit D
- 2628 Shoop Ave Unit A
- 2628 Shoop Ave
- 2628 Shoop Ave Unit G