Estimated Value: $213,000 - $295,000
--
Bed
1
Bath
2,127
Sq Ft
$121/Sq Ft
Est. Value
About This Home
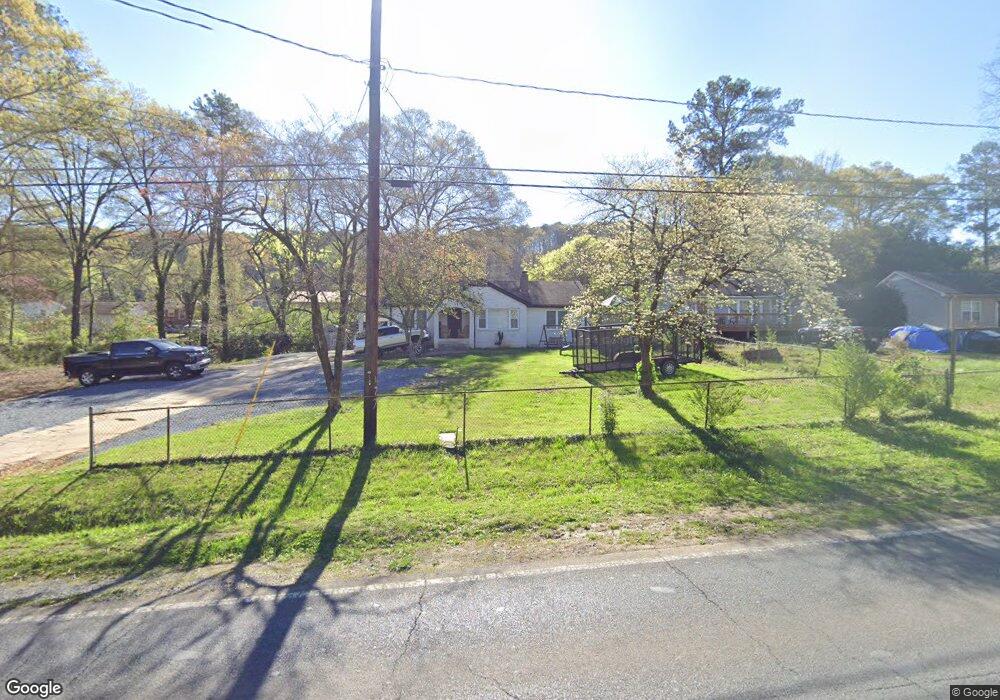
This home is located at 2821 Maple Rd SE, Rome, GA 30161 and is currently estimated at $256,982, approximately $120 per square foot. 2821 Maple Rd SE is a home located in Floyd County with nearby schools including Pepperell Middle School, Pepperell High School, and Montessori School of Rome.
Ownership History
Date
Name
Owned For
Owner Type
Purchase Details
Closed on
Jun 10, 2021
Sold by
Parker Jonathan
Bought by
Hooper Christopher
Current Estimated Value
Home Financials for this Owner
Home Financials are based on the most recent Mortgage that was taken out on this home.
Original Mortgage
$209,632
Outstanding Balance
$189,796
Interest Rate
2.9%
Mortgage Type
FHA
Estimated Equity
$67,186
Purchase Details
Closed on
Feb 27, 2020
Sold by
Lpp Mtg Inc
Bought by
Parker Jonathan
Purchase Details
Closed on
Nov 6, 2018
Sold by
Bell Mary W
Bought by
Lpp Mtg Inc
Purchase Details
Closed on
Dec 23, 1985
Sold by
Bell Mary W and Bell Darwin L
Bought by
Bell Mary W
Purchase Details
Closed on
Dec 30, 1983
Sold by
Bell Mary W
Bought by
Bell Mary W and Bell Darwin L
Purchase Details
Closed on
Nov 1, 1956
Sold by
Bell Mary W Int Ollie
Bought by
Bell Mary W Int
Purchase Details
Closed on
Sep 1, 1953
Bought by
Bell Mary W Int Ollie
Create a Home Valuation Report for This Property
The Home Valuation Report is an in-depth analysis detailing your home's value as well as a comparison with similar homes in the area
Home Values in the Area
Average Home Value in this Area
Purchase History
| Date | Buyer | Sale Price | Title Company |
|---|---|---|---|
| Hooper Christopher | $213,500 | -- | |
| Parker Jonathan | $50,500 | -- | |
| Lpp Mtg Inc | $105,855 | -- | |
| Bell Mary W | -- | -- | |
| Bell Mary W | -- | -- | |
| Bell Mary W Int | -- | -- | |
| Bell Mary W Int Ollie | -- | -- |
Source: Public Records
Mortgage History
| Date | Status | Borrower | Loan Amount |
|---|---|---|---|
| Open | Hooper Christopher | $209,632 |
Source: Public Records
Tax History Compared to Growth
Tax History
| Year | Tax Paid | Tax Assessment Tax Assessment Total Assessment is a certain percentage of the fair market value that is determined by local assessors to be the total taxable value of land and additions on the property. | Land | Improvement |
|---|---|---|---|---|
| 2024 | $2,771 | $102,735 | $10,800 | $91,935 |
| 2023 | $3,149 | $109,844 | $9,600 | $100,244 |
| 2022 | $2,534 | $91,476 | $8,000 | $83,476 |
| 2021 | $609 | $63,876 | $8,000 | $55,876 |
| 2020 | $1,942 | $63,816 | $6,000 | $57,816 |
| 2019 | $1,800 | $59,916 | $6,000 | $53,916 |
| 2018 | $437 | $56,016 | $6,000 | $50,016 |
| 2017 | $438 | $51,940 | $6,000 | $45,940 |
| 2016 | $443 | $49,424 | $6,000 | $43,424 |
| 2015 | $413 | $49,424 | $6,000 | $43,424 |
| 2014 | $413 | $49,424 | $6,000 | $43,424 |
Source: Public Records
Map
Nearby Homes
- 2812 Maple Rd SE
- 327 Flora Ave SE
- 333 Alfred Ave SE
- 409 Flora Ave SE
- 2710 Maple Rd SE
- 226 Flora Ave SE
- 3014 Maple Rd SE
- 212 Alfred Ave SE
- 211 Alfred Ave SE
- 2523 Maple Rd SE
- 36 Saddle Mountain Rd SE
- 2508 Maple Rd SE
- 2501 Maple Rd SE
- 13 Spring Cir SE
- 107 E Linden St SE
- 3 Belmont Ct SE
- 0 Martha Berry Hwy Unit 7525627
- 0 Martha Berry Hwy Unit 7614774
- 0 Martha Berry Hwy Unit 10563404
- 15 Saddlebrook Dr SE
- 2821 Maple Rd SE
- 2823 Maple Rd SE
- 2825 Maple Rd SE
- 316 Flora Ave SE
- 320 Flora Ave SE
- 314 Flora Ave SE
- 2827 Maple Rd SE
- 2815 Maple Rd SE
- 322 Flora Ave SE
- 2824 Maple Rd SE
- 2824 Maple Rd SE
- 2824 Maple Rd SE
- 312 Flora Ave SE
- 2829 Maple Rd SE
- 2816 Maple Rd SE
- 2828 Maple Rd SE
- 324 Flora Ave SE
- 2809 Maple 2807 Rd SE
- 2809 Maple Rd SE
- 2814 Maple Rd SE