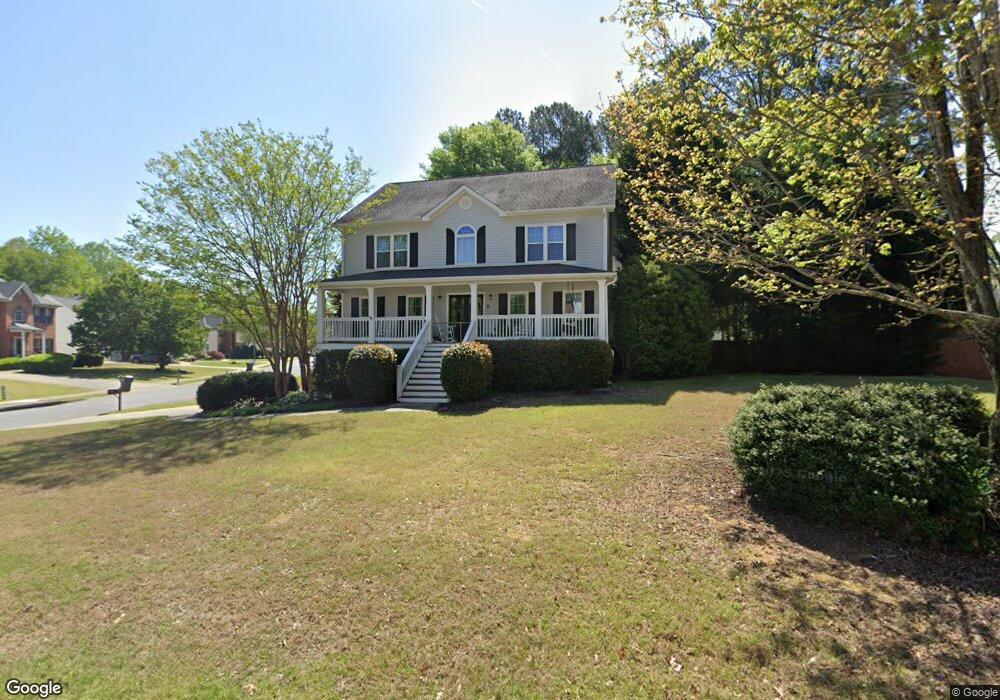
2821 Penncross Dr SW Unit 2 Marietta, GA 30064
West Cobb NeighborhoodEstimated Value: $467,734 - $583,000
4
Beds
3
Baths
2,388
Sq Ft
$217/Sq Ft
Est. Value
About This Home
This home is located at 2821 Penncross Dr SW Unit 2, Marietta, GA 30064 and is currently estimated at $518,434, approximately $217 per square foot. 2821 Penncross Dr SW Unit 2 is a home located in Cobb County with nearby schools including Cheatham Hill Elementary School, Lovinggood Middle School, and Hillgrove High School.
Ownership History
Date
Name
Owned For
Owner Type
Purchase Details
Closed on
Jan 30, 2002
Sold by
Sublett Darren J
Bought by
Lewis Keith E and Lewis Mae C
Current Estimated Value
Home Financials for this Owner
Home Financials are based on the most recent Mortgage that was taken out on this home.
Original Mortgage
$173,057
Outstanding Balance
$71,121
Interest Rate
7.12%
Mortgage Type
FHA
Estimated Equity
$447,313
Purchase Details
Closed on
Jun 19, 2000
Sold by
Stahley Robert F and Stahley Carla P
Bought by
Sublet Darren J and Sublet Pamela
Home Financials for this Owner
Home Financials are based on the most recent Mortgage that was taken out on this home.
Original Mortgage
$169,990
Interest Rate
8.63%
Mortgage Type
FHA
Create a Home Valuation Report for This Property
The Home Valuation Report is an in-depth analysis detailing your home's value as well as a comparison with similar homes in the area
Home Values in the Area
Average Home Value in this Area
Purchase History
| Date | Buyer | Sale Price | Title Company |
|---|---|---|---|
| Lewis Keith E | $182,000 | -- | |
| Sublet Darren J | $178,500 | -- |
Source: Public Records
Mortgage History
| Date | Status | Borrower | Loan Amount |
|---|---|---|---|
| Open | Lewis Keith E | $173,057 | |
| Previous Owner | Sublet Darren J | $169,990 |
Source: Public Records
Tax History Compared to Growth
Tax History
| Year | Tax Paid | Tax Assessment Tax Assessment Total Assessment is a certain percentage of the fair market value that is determined by local assessors to be the total taxable value of land and additions on the property. | Land | Improvement |
|---|---|---|---|---|
| 2025 | $4,556 | $194,444 | $50,000 | $144,444 |
| 2024 | $4,560 | $194,444 | $50,000 | $144,444 |
| 2023 | $3,512 | $171,168 | $22,800 | $148,368 |
| 2022 | $3,429 | $141,088 | $22,800 | $118,288 |
| 2021 | $2,882 | $116,108 | $22,800 | $93,308 |
| 2020 | $2,882 | $116,108 | $22,800 | $93,308 |
| 2019 | $2,882 | $116,108 | $22,800 | $93,308 |
| 2018 | $2,523 | $99,728 | $22,800 | $76,928 |
| 2017 | $2,427 | $99,728 | $22,800 | $76,928 |
| 2016 | $2,431 | $99,728 | $22,800 | $76,928 |
| 2015 | $1,877 | $72,544 | $22,800 | $49,744 |
| 2014 | $1,893 | $72,544 | $0 | $0 |
Source: Public Records
Map
Nearby Homes
- 1209 Wilkes Way SW Unit 1
- 1237 Wynford Woods SW
- 2563 Irwin Lake Overlook Rd SW
- 1331 Wynford Chase SW Unit 1
- 3033 Addie Pond Way SW
- 1518 Sage Ridge Dr
- 2613 Lakefield Ct
- 3072 Addie Pond Way SW
- 2722 Sandy Irwin Ct SW
- 3003 Lawson Dr
- 1274 Wynford Colony SW
- 1239 Bonshaw Trail Unit 3
- 2403 Bonshaw Ln
- 1227 Bonshaw Trail
- 1214 Bonshaw Trail
- 2341 Habersham Dr SW
- 3028 Hallman Cir SW
- 946 Steadman Terrace SW
- 1555 Vine Leaf Dr
- 1884 Dovonshire Rd SW
- 1255 Penncross Ct SW
- 2819 Penncross Dr SW Unit 57
- 2819 Penncross Dr SW
- 1254 Penncross Ct SW
- 1242 Penncross Way SW Unit 2
- 2820 Penncross Dr SW Unit 2
- 2824 Penncross Dr SW Unit 2
- 2822 Penncross Dr SW
- 1256 Penncross Ct SW
- 1244 Penncross Way SW
- 1261 Penncross Ct SW Unit 3
- 2818 Penncross Dr SW
- 2826 Penncross Dr SW
- 1258 Penncross Ct SW Unit 3
- 2816 Penncross Dr SW
- 2827 Penncross Dr SW
- 1241 Penncross Way SW
- 1260 Penncross Ct SW
- 1263 Penncross Ct SW
- 1263 Penncross Court South W