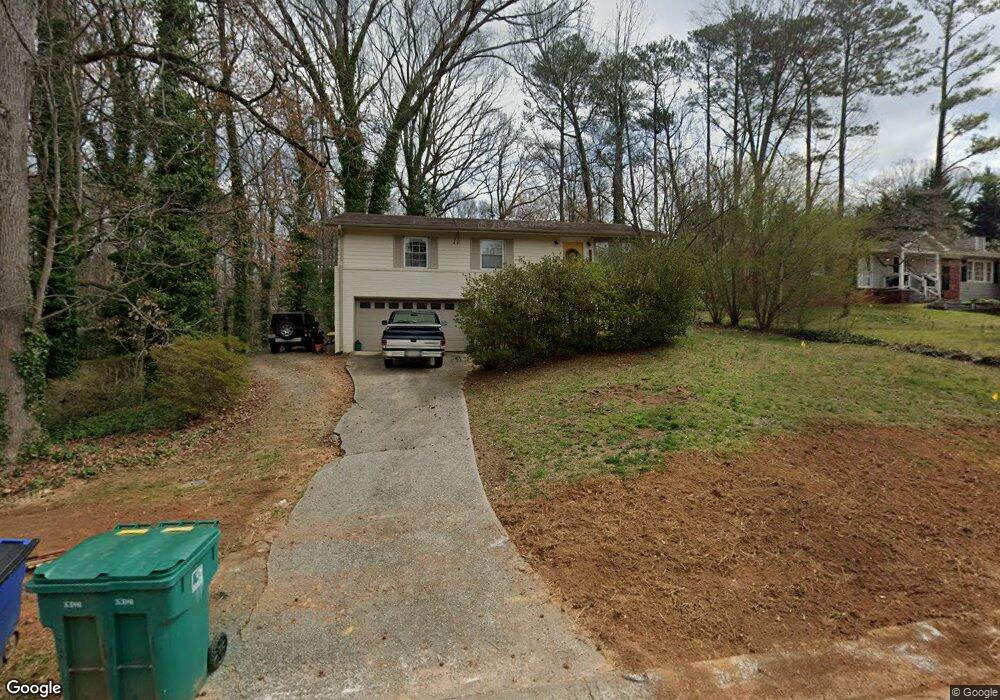
2821 Spring Creek Place SE Smyrna, GA 30080
Estimated Value: $364,000 - $446,000
3
Beds
2
Baths
1,440
Sq Ft
$275/Sq Ft
Est. Value
About This Home
This home is located at 2821 Spring Creek Place SE, Smyrna, GA 30080 and is currently estimated at $395,775, approximately $274 per square foot. 2821 Spring Creek Place SE is a home located in Cobb County with nearby schools including Smyrna Elementary School, Campbell Middle School, and Campbell High School.
Ownership History
Date
Name
Owned For
Owner Type
Purchase Details
Closed on
Feb 4, 2025
Sold by
Techman Kell Alexander Niels and Techman Lauren Kell
Bought by
Ashley Lauren Kell Living Trust and Kell
Current Estimated Value
Purchase Details
Closed on
Jul 5, 2016
Sold by
Alexander N
Bought by
Kell Alexander Niels Techman and Kell Ashley Lauren
Home Financials for this Owner
Home Financials are based on the most recent Mortgage that was taken out on this home.
Original Mortgage
$142,572
Interest Rate
3.6%
Mortgage Type
New Conventional
Purchase Details
Closed on
Jan 7, 2010
Sold by
Kelley Charles R and Kelley Dorothy
Bought by
Kell Alexander N and Topping Peter
Home Financials for this Owner
Home Financials are based on the most recent Mortgage that was taken out on this home.
Original Mortgage
$155,677
Interest Rate
4.75%
Mortgage Type
FHA
Create a Home Valuation Report for This Property
The Home Valuation Report is an in-depth analysis detailing your home's value as well as a comparison with similar homes in the area
Home Values in the Area
Average Home Value in this Area
Purchase History
| Date | Buyer | Sale Price | Title Company |
|---|---|---|---|
| Ashley Lauren Kell Living Trust | -- | None Listed On Document | |
| Ashley Lauren Kell Living Trust | -- | None Listed On Document | |
| Kell Alexander Niels Techman | $205,000 | -- | |
| Kell Alexander N | $170,000 | -- |
Source: Public Records
Mortgage History
| Date | Status | Borrower | Loan Amount |
|---|---|---|---|
| Previous Owner | Kell Alexander Niels Techman | $142,572 | |
| Previous Owner | Kell Alexander N | $155,677 |
Source: Public Records
Tax History Compared to Growth
Tax History
| Year | Tax Paid | Tax Assessment Tax Assessment Total Assessment is a certain percentage of the fair market value that is determined by local assessors to be the total taxable value of land and additions on the property. | Land | Improvement |
|---|---|---|---|---|
| 2025 | $4,149 | $152,744 | $44,000 | $108,744 |
| 2024 | $4,149 | $152,744 | $44,000 | $108,744 |
| 2023 | $4,149 | $152,744 | $44,000 | $108,744 |
| 2022 | $2,741 | $100,184 | $22,000 | $78,184 |
| 2021 | $2,754 | $100,184 | $22,000 | $78,184 |
| 2020 | $2,290 | $83,288 | $20,000 | $63,288 |
| 2019 | $2,290 | $83,288 | $20,000 | $63,288 |
| 2018 | $1,655 | $60,196 | $16,000 | $44,196 |
| 2017 | $1,552 | $60,196 | $16,000 | $44,196 |
| 2016 | $1,552 | $60,196 | $16,000 | $44,196 |
| 2015 | $1,237 | $46,872 | $18,000 | $28,872 |
| 2014 | $1,249 | $46,872 | $0 | $0 |
Source: Public Records
Map
Nearby Homes
- 501 Country Park Dr SE
- 110 Countryside Place SE
- 108 Countryside Place SE
- 307 Country Park Dr SE
- 907 Country Park Dr SE
- 2051 Dundee Dr SE
- 2308 Country Park Dr SE
- 1904 Country Park Dr SE
- 801 Countryside Place SE
- 2010 Glenroy Dr SE
- 1108 Country Park Dr SE
- 1502 Countryside Place SE
- 1142 Drewsbury Ct SE
- 2731 Carolyn Dr SE
- 1601 Countryside Place SE
- 2640 Spring Dr SE
- 2668 Farmstead Rd SE
- 1572 Wicker Wood Place
- 1572 Wicker Wood SE
- 1576 Wicker Wood Place
- 2831 Spring Creek Place SE
- 2799 Spring Creek Place SE
- 2816 Arden Way SE
- 2800 Arden Way SE
- 2830 Arden Way SE
- 2791 Spring Creek Place SE
- 2818 Spring Creek Place SE
- 2790 Arden Way SE
- 2800 Spring Creek Place SE
- 2830 Spring Creek Place SE
- 2170 Beech Valley Dr SE
- 2790 Spring Creek Place SE
- 2186 Beech Valley Dr SE
- 2817 Arden Way SE
- 2780 Spring Creek Place SE
- 2799 Arden Way SE
- 2829 Arden Way SE
- 2208 Beech Valley Dr SE
- 2772 Spring Creek Place SE