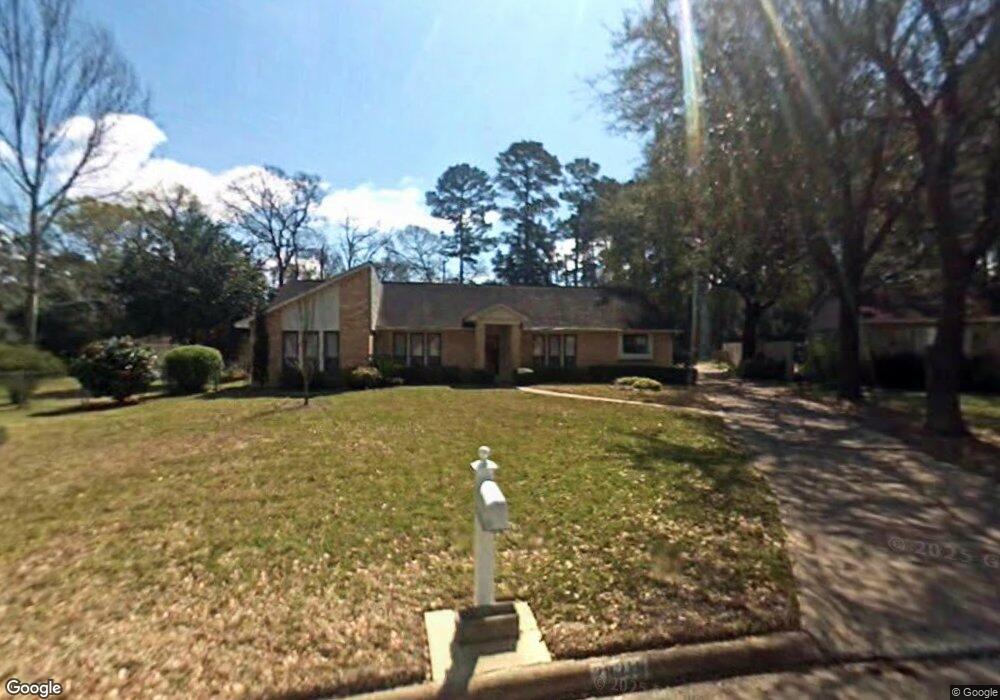
28218 Heidi Ln Tomball, TX 77375
Estimated Value: $349,000 - $377,000
3
Beds
2
Baths
2,037
Sq Ft
$177/Sq Ft
Est. Value
About This Home
This home is located at 28218 Heidi Ln, Tomball, TX 77375 and is currently estimated at $360,689, approximately $177 per square foot. 28218 Heidi Ln is a home located in Harris County with nearby schools including Tomball Elementary School, Tomball Intermediate School, and Tomball Junior High School.
Ownership History
Date
Name
Owned For
Owner Type
Purchase Details
Closed on
Nov 6, 2017
Sold by
Millsaps Jerry
Bought by
Depriest Jill R and Depriest Douglas W
Current Estimated Value
Home Financials for this Owner
Home Financials are based on the most recent Mortgage that was taken out on this home.
Original Mortgage
$160,000
Outstanding Balance
$134,001
Interest Rate
3.83%
Mortgage Type
New Conventional
Estimated Equity
$226,688
Purchase Details
Closed on
Aug 23, 2001
Sold by
Millsaps Joe F and Millsaps Jerry
Bought by
Millsaps Joe F and Millsaps Jerry
Purchase Details
Closed on
Oct 31, 1997
Sold by
Smith Shirley A and Smith Larry R
Bought by
Millsaps Joe F and Millsaps Jerry
Home Financials for this Owner
Home Financials are based on the most recent Mortgage that was taken out on this home.
Original Mortgage
$106,400
Interest Rate
7.33%
Create a Home Valuation Report for This Property
The Home Valuation Report is an in-depth analysis detailing your home's value as well as a comparison with similar homes in the area
Home Values in the Area
Average Home Value in this Area
Purchase History
| Date | Buyer | Sale Price | Title Company |
|---|---|---|---|
| Depriest Jill R | -- | None Available | |
| Millsaps Joe F | -- | -- | |
| Millsaps Joe F | -- | Alamo Title |
Source: Public Records
Mortgage History
| Date | Status | Borrower | Loan Amount |
|---|---|---|---|
| Open | Depriest Jill R | $160,000 | |
| Previous Owner | Millsaps Joe F | $106,400 |
Source: Public Records
Tax History Compared to Growth
Tax History
| Year | Tax Paid | Tax Assessment Tax Assessment Total Assessment is a certain percentage of the fair market value that is determined by local assessors to be the total taxable value of land and additions on the property. | Land | Improvement |
|---|---|---|---|---|
| 2025 | $5,556 | $336,434 | $102,655 | $233,779 |
| 2024 | $5,556 | $342,912 | $102,655 | $240,257 |
| 2023 | $5,556 | $334,268 | $98,630 | $235,638 |
| 2022 | $5,920 | $289,183 | $92,591 | $196,592 |
| 2021 | $5,662 | $238,750 | $75,482 | $163,268 |
| 2020 | $5,562 | $226,756 | $65,418 | $161,338 |
| 2019 | $5,247 | $223,609 | $50,321 | $173,288 |
| 2018 | $2,199 | $189,083 | $46,296 | $142,787 |
| 2017 | $4,765 | $189,083 | $46,296 | $142,787 |
| 2016 | $4,765 | $189,083 | $46,296 | $142,787 |
| 2015 | $829 | $173,538 | $46,296 | $127,242 |
| 2014 | $829 | $173,538 | $46,296 | $127,242 |
Source: Public Records
Map
Nearby Homes
- 14222 Spring Pines Dr
- 14123 Spring Pines Dr
- 14210 Altair Dr
- 28102 Linda Ln
- 31318 Bearing Star Ln
- 14134 Pollux Ct
- 14219 Turnervine Dr
- 31335 Bearing Star Ln
- 31407 Bearing Star Ln
- 31410 Bearing Star Ln
- 11211 Stirton Dr
- 11235 Stirton Dr
- 1319 Pine Trail
- 1310 Big Pines
- 1315 Big Pines
- 1302 Pine Trail
- 1314 Pine Brook
- 930 Arbor Pine
- 0 Keen Rd
- 14906 Quaking Aspen Dr
- 28214 Heidi Ln
- 31102 Alice Ln
- 28210 Heidi Ln
- 31103 Alice Ln
- 31106 Alice Ln
- 30331 Winfro Dr
- 28206 Heidi Ln
- 31106 Antonia Ln
- 30335 Winfro Dr
- 31110 Alice Ln
- 31110 Antonia Ln
- 14231 Spring Pines Dr
- 28202 Heidi Ln
- 31114 Antonia Ln
- 30327 Winfro Dr
- 14227 Spring Pines Dr
- 31114 Alice Ln
- 31115 Alice Ln
- 28118 Heidi Ln
- 31118 Antonia Ln