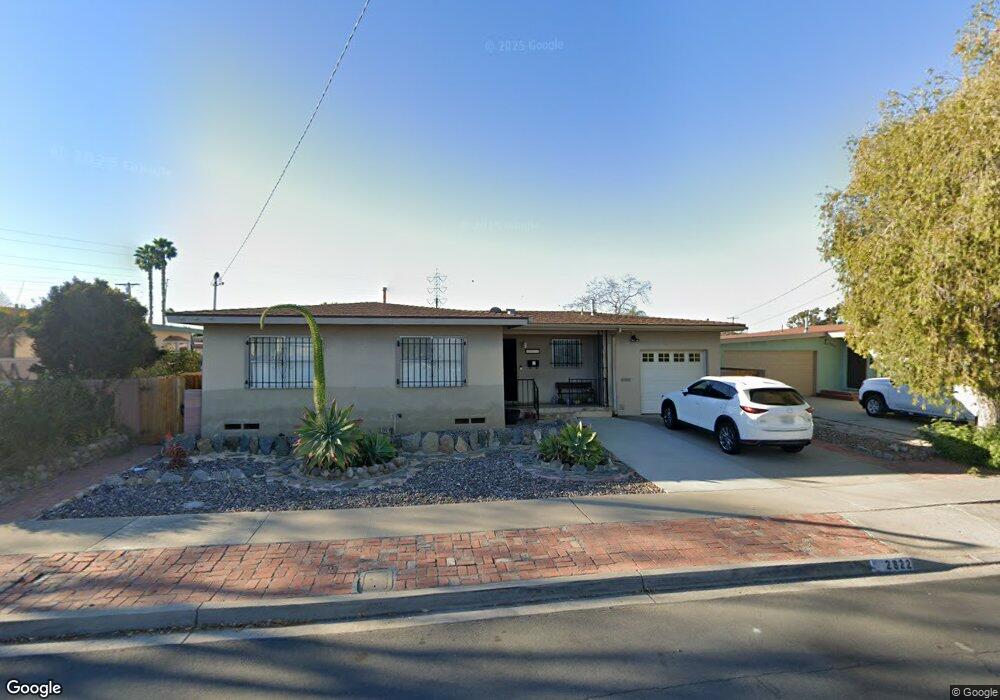
2822 Chalar St San Diego, CA 92123
Serra Mesa NeighborhoodEstimated Value: $870,000 - $1,051,000
3
Beds
2
Baths
1,210
Sq Ft
$787/Sq Ft
Est. Value
About This Home
This home is located at 2822 Chalar St, San Diego, CA 92123 and is currently estimated at $952,423, approximately $787 per square foot. 2822 Chalar St is a home located in San Diego County with nearby schools including Jones Elementary School, Taft Middle School, and Elevate Elementary School.
Ownership History
Date
Name
Owned For
Owner Type
Purchase Details
Closed on
Jul 20, 2021
Sold by
Nunes Carolyn N and Jones Nancy D
Bought by
Cunningham April and Cunningham Carrie
Current Estimated Value
Purchase Details
Closed on
Jan 13, 2009
Sold by
Jones Mary A
Bought by
Jones Richard W and Jones Mary A
Purchase Details
Closed on
Oct 11, 1994
Sold by
Crooks Nadine S
Bought by
Crooks Nadine S
Create a Home Valuation Report for This Property
The Home Valuation Report is an in-depth analysis detailing your home's value as well as a comparison with similar homes in the area
Home Values in the Area
Average Home Value in this Area
Purchase History
| Date | Buyer | Sale Price | Title Company |
|---|---|---|---|
| Cunningham April | -- | None Available | |
| Jones Richard W | -- | None Available | |
| Jones Mary A | -- | None Available | |
| Crooks Nadine S | -- | -- | |
| Crooks Nadine S | -- | -- |
Source: Public Records
Tax History Compared to Growth
Tax History
| Year | Tax Paid | Tax Assessment Tax Assessment Total Assessment is a certain percentage of the fair market value that is determined by local assessors to be the total taxable value of land and additions on the property. | Land | Improvement |
|---|---|---|---|---|
| 2025 | $8,506 | $703,578 | $622,397 | $81,181 |
| 2024 | $8,506 | $689,784 | $610,194 | $79,590 |
| 2023 | $8,318 | $676,260 | $598,230 | $78,030 |
| 2022 | $8,097 | $663,000 | $586,500 | $76,500 |
| 2021 | $1,284 | $101,510 | $18,327 | $83,183 |
| 2020 | $1,268 | $100,471 | $18,140 | $82,331 |
| 2019 | $1,246 | $98,502 | $17,785 | $80,717 |
| 2018 | $1,167 | $96,572 | $17,437 | $79,135 |
| 2017 | $1,139 | $94,680 | $17,096 | $77,584 |
| 2016 | $1,120 | $92,824 | $16,761 | $76,063 |
| 2015 | $1,103 | $91,431 | $16,510 | $74,921 |
| 2014 | $1,087 | $89,641 | $16,187 | $73,454 |
Source: Public Records
Map
Nearby Homes
- 8874 Gowdy Ave
- 2421 Casement St
- 8441 Encino Ave
- 3216 Towser St
- 3161 Skipper St
- 7830 Nightingale Way
- 7813 Starling Dr
- 7810 Nightingale Way
- 8805 Laddie Ln
- 7855 Hummingbird Ln
- 2750 Walker Dr
- 2376 Ron Way
- 8955 Gramercy Dr
- 2660 Pheasant Dr
- 8975 Gramercy Dr
- 7613 Family Cir Unit LU5
- 3531 Milagros St
- 7555 Linda Vista Unit 9
- 2706 Via Alta Place
- 2921 Via Alta Place
- 2805 Andrea Ave
- 2832 Chalar St
- 8511 Andrea Ct
- 2815 Andrea Ave
- 2844 Chalar St
- 8521 Andrea Ct
- 8573 Fireside Ave
- 2815 Chalar St
- 2825 Chalar St
- 2802 Andrea Ave
- 8563 Fireside Ave
- 2805 Chalar St
- 2835 Chalar St
- 2791 Chalar St
- 2810 Andrea Ave
- 8605 Fireside Ave
- 8553 Fireside Ave
- 8512 Andrea Ct
- 2792 Chalar St
- 2841 Andrea Ave