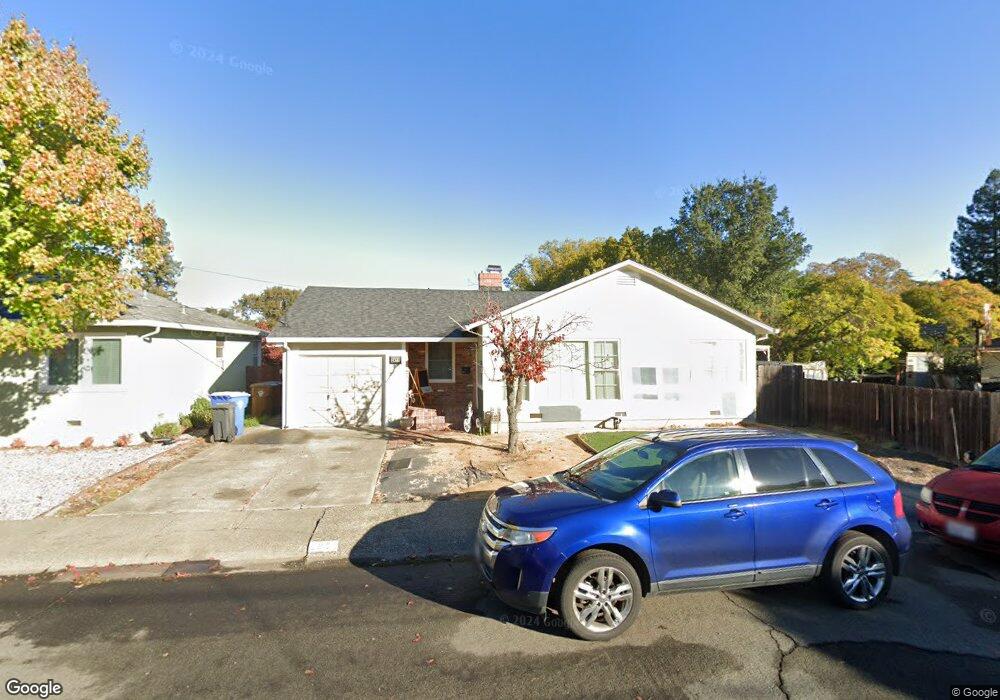
2822 Cypress St Napa, CA 94558
Westwood NeighborhoodEstimated Value: $621,000 - $808,000
3
Beds
1
Bath
1,018
Sq Ft
$675/Sq Ft
Est. Value
About This Home
This home is located at 2822 Cypress St, Napa, CA 94558 and is currently estimated at $686,779, approximately $674 per square foot. 2822 Cypress St is a home located in Napa County with nearby schools including Snow Elementary School, Harvest Middle School, and Napa High School.
Ownership History
Date
Name
Owned For
Owner Type
Purchase Details
Closed on
Oct 3, 2008
Sold by
Mckinnon Earl E and Mckinnon Rachel D
Bought by
Fiske Heather E and Avila Jaime L
Current Estimated Value
Home Financials for this Owner
Home Financials are based on the most recent Mortgage that was taken out on this home.
Original Mortgage
$252,000
Outstanding Balance
$166,569
Interest Rate
6.39%
Mortgage Type
Purchase Money Mortgage
Estimated Equity
$520,210
Purchase Details
Closed on
Jul 26, 2005
Sold by
Stewart Analyn M and Stewart Andrew E
Bought by
Mckinnon Earl E and Mckinnon Rachel D
Home Financials for this Owner
Home Financials are based on the most recent Mortgage that was taken out on this home.
Original Mortgage
$420,000
Interest Rate
5.5%
Mortgage Type
Purchase Money Mortgage
Purchase Details
Closed on
Aug 6, 2001
Sold by
Wagner Louise A
Bought by
Stewart Andrew E and Stewart Analyn M
Home Financials for this Owner
Home Financials are based on the most recent Mortgage that was taken out on this home.
Original Mortgage
$259,350
Interest Rate
7.1%
Create a Home Valuation Report for This Property
The Home Valuation Report is an in-depth analysis detailing your home's value as well as a comparison with similar homes in the area
Home Values in the Area
Average Home Value in this Area
Purchase History
| Date | Buyer | Sale Price | Title Company |
|---|---|---|---|
| Fiske Heather E | $315,000 | North American Title Company | |
| Mckinnon Earl E | $525,000 | Fidelity National Title Co | |
| Stewart Andrew E | $273,000 | Napa Land Title Company |
Source: Public Records
Mortgage History
| Date | Status | Borrower | Loan Amount |
|---|---|---|---|
| Open | Fiske Heather E | $252,000 | |
| Previous Owner | Mckinnon Earl E | $420,000 | |
| Previous Owner | Stewart Andrew E | $259,350 |
Source: Public Records
Tax History Compared to Growth
Tax History
| Year | Tax Paid | Tax Assessment Tax Assessment Total Assessment is a certain percentage of the fair market value that is determined by local assessors to be the total taxable value of land and additions on the property. | Land | Improvement |
|---|---|---|---|---|
| 2025 | $5,130 | $405,631 | $225,353 | $180,278 |
| 2024 | $5,130 | $397,679 | $220,935 | $176,744 |
| 2023 | $5,130 | $389,882 | $216,603 | $173,279 |
| 2022 | $4,984 | $382,238 | $212,356 | $169,882 |
| 2021 | $4,917 | $374,744 | $208,193 | $166,551 |
| 2020 | $4,882 | $370,903 | $206,059 | $164,844 |
| 2019 | $4,775 | $363,631 | $202,019 | $161,612 |
| 2018 | $4,701 | $356,502 | $198,058 | $158,444 |
| 2017 | $4,596 | $349,513 | $194,175 | $155,338 |
| 2016 | $4,480 | $342,661 | $190,368 | $152,293 |
| 2015 | $4,180 | $337,515 | $187,509 | $150,006 |
| 2014 | $4,077 | $327,600 | $113,400 | $214,200 |
Source: Public Records
Map
Nearby Homes
- 295 Foothill Blvd
- 521 Roosevelt St
- 115 Poe Ct
- 157 Homewood Ave
- 154 Cherryview Ct
- 2512 Old Sonoma Rd
- 72 Bellevue Ave
- 134 Valley Oak Dr
- 2592 1st St
- 3181 Tiffanie Ln
- 703 Casswall St
- 1010 Easum Dr
- 420 Montgomery St
- 2561 Dorset St
- 631 Casswall St
- 747 Seymour St
- 2984 1st St
- 2010 Old Sonoma Rd
- 2364 Clay St
- 505 Madison St
- 2836 Cypress St
- 2802 Cypress St
- 471 Roosevelt St
- 2850 Cypress St
- 2833 Hilltop Dr
- 481 Roosevelt St
- 2849 Hilltop Dr
- 2823 Cypress St
- 2865 Hilltop Dr
- 2862 Cypress St
- 2837 Cypress St
- 2811 Cypress St
- 2849 Cypress St
- 2803 Cypress St
- 2881 Hilltop Dr
- 2861 Cypress St
- 424 Foothill Blvd
- 448 Foothill Blvd
- 321 Roosevelt St
- 472 Foothill Blvd