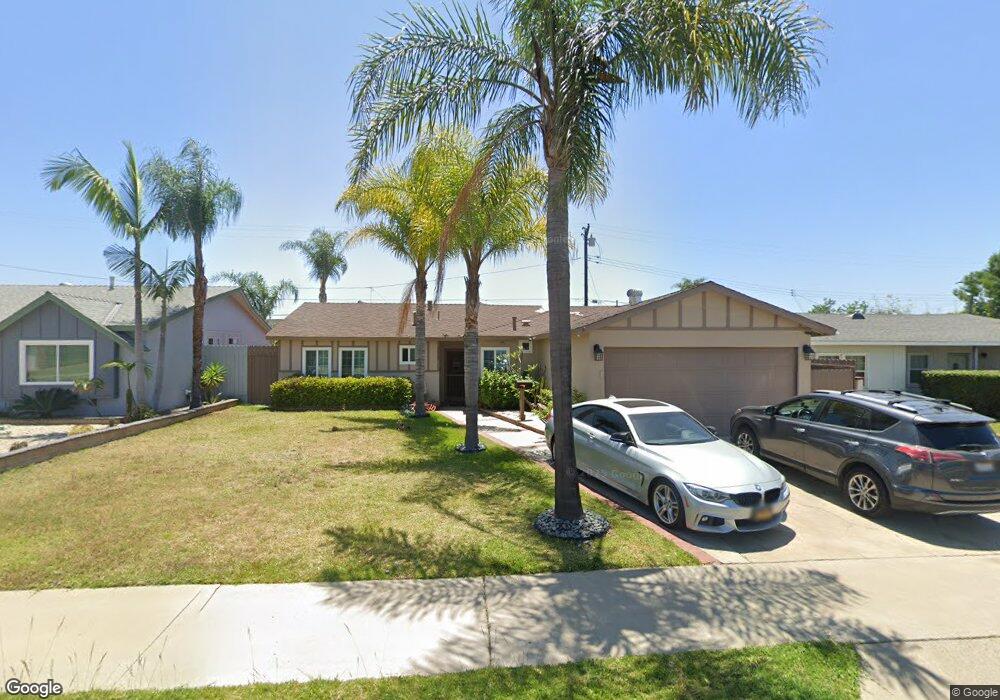
2822 E Hamilton Ave Orange, CA 92867
Estimated Value: $971,388 - $1,025,000
3
Beds
2
Baths
1,269
Sq Ft
$787/Sq Ft
Est. Value
About This Home
This home is located at 2822 E Hamilton Ave, Orange, CA 92867 and is currently estimated at $998,597, approximately $786 per square foot. 2822 E Hamilton Ave is a home located in Orange County with nearby schools including Handy Elementary School, Yorba Middle School, and Orange High School.
Ownership History
Date
Name
Owned For
Owner Type
Purchase Details
Closed on
Aug 14, 2024
Sold by
Noori Nasir Ahmed and Noori Nasrin Z
Bought by
Noori Family Trust and Noori
Current Estimated Value
Purchase Details
Closed on
Apr 9, 2003
Sold by
Smith Mary Ann and Ramirez Salvador A
Bought by
Noori Nasir Ahmed and Noori Nasrin Z
Home Financials for this Owner
Home Financials are based on the most recent Mortgage that was taken out on this home.
Original Mortgage
$291,600
Interest Rate
4.87%
Mortgage Type
Purchase Money Mortgage
Purchase Details
Closed on
May 14, 1997
Sold by
Uber Edward D and Uber Marie A
Bought by
Smith Mary Ann and Ramirez Salvador A
Home Financials for this Owner
Home Financials are based on the most recent Mortgage that was taken out on this home.
Original Mortgage
$161,900
Interest Rate
7.94%
Create a Home Valuation Report for This Property
The Home Valuation Report is an in-depth analysis detailing your home's value as well as a comparison with similar homes in the area
Home Values in the Area
Average Home Value in this Area
Purchase History
| Date | Buyer | Sale Price | Title Company |
|---|---|---|---|
| Noori Family Trust | -- | None Listed On Document | |
| Noori Nasir Ahmed | $364,500 | Lawyers Title Company | |
| Smith Mary Ann | $180,000 | Orange Coast Title |
Source: Public Records
Mortgage History
| Date | Status | Borrower | Loan Amount |
|---|---|---|---|
| Previous Owner | Noori Nasir Ahmed | $291,600 | |
| Previous Owner | Smith Mary Ann | $161,900 |
Source: Public Records
Tax History
| Year | Tax Paid | Tax Assessment Tax Assessment Total Assessment is a certain percentage of the fair market value that is determined by local assessors to be the total taxable value of land and additions on the property. | Land | Improvement |
|---|---|---|---|---|
| 2025 | $5,790 | $527,911 | $456,235 | $71,676 |
| 2024 | $5,790 | $517,560 | $447,289 | $70,271 |
| 2023 | $5,660 | $507,412 | $438,518 | $68,894 |
| 2022 | $5,549 | $497,463 | $429,919 | $67,544 |
| 2021 | $5,394 | $487,709 | $421,489 | $66,220 |
| 2020 | $5,343 | $482,709 | $417,168 | $65,541 |
| 2019 | $5,276 | $473,245 | $408,989 | $64,256 |
| 2018 | $5,194 | $463,966 | $400,969 | $62,997 |
| 2017 | $4,979 | $454,869 | $393,107 | $61,762 |
| 2016 | $4,882 | $445,950 | $385,399 | $60,551 |
| 2015 | $4,810 | $439,252 | $379,610 | $59,642 |
| 2014 | $4,706 | $430,648 | $372,174 | $58,474 |
Source: Public Records
Map
Nearby Homes
- 2929 E Hamilton Ave
- 692 N Adele St Unit 50
- 692 N Adele St Unit 30
- 692 N Adele St Unit 78
- 2705 E Orange Grove Ave
- 773 N Elmwood St
- 2720 E Walnut Ave Unit 73
- 605 N Pageant Dr Unit B
- 3527 E Barrington Dr
- 478 N Swidler St
- 448 N Londonderry Ln Unit D
- 3406 E Lochleven Ln Unit B
- 3139 E Chapman Ave Unit 3B
- 2710 E Adams Ave
- 1920 E Barkley Ave
- 3801 E Spring St
- 1163 N Hart St
- 18062 Rosanne Cir
- 1166 N Handy St
- 2331 E Adams Ave
- 2830 E Hamilton Ave
- 2812 E Hamilton Ave
- 2825 E Orange Grove Ave
- 2815 E Orange Grove Ave
- 2840 E Hamilton Ave
- 2804 E Hamilton Ave
- 2835 E Orange Grove Ave
- 2823 E Hamilton Ave
- 2803 E Orange Grove Ave
- 2815 E Hamilton Ave
- 2831 E Hamilton Ave
- 2845 E Orange Grove Ave
- 2848 E Hamilton Ave
- 2748 E Hamilton Ave
- 2805 E Hamilton Ave
- 2841 E Hamilton Ave
- 2901 E Orange Grove Ave
- 584 N Malena St
- 2900 E Hamilton Ave
- 2738 E Hamilton Ave
Your Personal Tour Guide
Ask me questions while you tour the home.