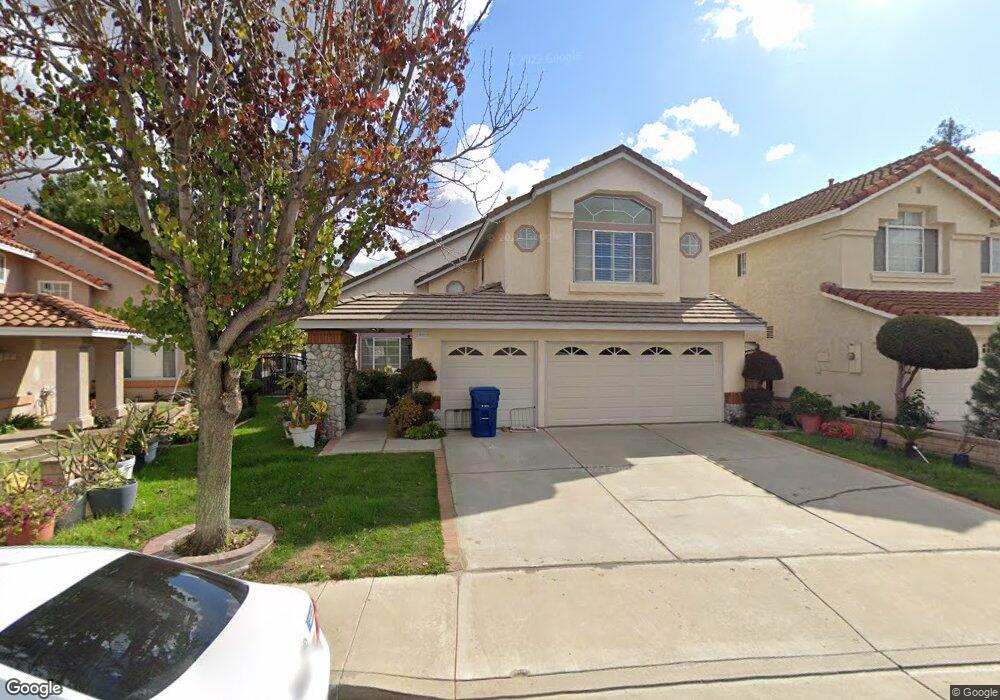
2822 Kinnow Place Rowland Heights, CA 91748
Estimated Value: $1,322,036 - $1,475,000
4
Beds
3
Baths
2,692
Sq Ft
$526/Sq Ft
Est. Value
About This Home
This home is located at 2822 Kinnow Place, Rowland Heights, CA 91748 and is currently estimated at $1,417,259, approximately $526 per square foot. 2822 Kinnow Place is a home located in Los Angeles County with nearby schools including Alvarado Intermediate School, John A. Rowland High School, and Southlands Christian Schools.
Ownership History
Date
Name
Owned For
Owner Type
Purchase Details
Closed on
Aug 2, 2020
Sold by
Naing Win and Naing Lili W
Bought by
Fhln Sein Tin Trust and Ong
Current Estimated Value
Purchase Details
Closed on
May 24, 2002
Sold by
Chiang Yung Lin and Wei An Yeh
Bought by
Naing Win and Ma Lili W
Home Financials for this Owner
Home Financials are based on the most recent Mortgage that was taken out on this home.
Original Mortgage
$350,000
Interest Rate
5.87%
Mortgage Type
Negative Amortization
Purchase Details
Closed on
Oct 7, 1997
Sold by
Kato Paige T
Bought by
Chiang Yung Lin and Wei An Yeh
Home Financials for this Owner
Home Financials are based on the most recent Mortgage that was taken out on this home.
Original Mortgage
$120,000
Interest Rate
7.49%
Mortgage Type
Purchase Money Mortgage
Create a Home Valuation Report for This Property
The Home Valuation Report is an in-depth analysis detailing your home's value as well as a comparison with similar homes in the area
Home Values in the Area
Average Home Value in this Area
Purchase History
| Date | Buyer | Sale Price | Title Company |
|---|---|---|---|
| Fhln Sein Tin Trust | -- | None Listed On Document | |
| Naing Win | $437,500 | Stewart Title | |
| Chiang Yung Lin | $310,000 | American Title Ins Co |
Source: Public Records
Mortgage History
| Date | Status | Borrower | Loan Amount |
|---|---|---|---|
| Previous Owner | Naing Win | $350,000 | |
| Previous Owner | Chiang Yung Lin | $120,000 |
Source: Public Records
Tax History Compared to Growth
Tax History
| Year | Tax Paid | Tax Assessment Tax Assessment Total Assessment is a certain percentage of the fair market value that is determined by local assessors to be the total taxable value of land and additions on the property. | Land | Improvement |
|---|---|---|---|---|
| 2025 | $12,261 | $989,341 | $556,369 | $432,972 |
| 2024 | $12,261 | $969,943 | $545,460 | $424,483 |
| 2023 | $11,745 | $950,925 | $534,765 | $416,160 |
| 2022 | $11,489 | $932,280 | $524,280 | $408,000 |
| 2021 | $7,404 | $585,374 | $321,389 | $263,985 |
| 2020 | $7,307 | $579,373 | $318,094 | $261,279 |
| 2019 | $7,131 | $568,013 | $311,857 | $256,156 |
| 2018 | $6,860 | $556,877 | $305,743 | $251,134 |
| 2016 | $8,292 | $535,255 | $293,872 | $241,383 |
| 2015 | $8,183 | $527,216 | $289,458 | $237,758 |
| 2014 | $7,945 | $516,889 | $283,788 | $233,101 |
Source: Public Records
Map
Nearby Homes
- 18593 Fieldbrook St
- 18555 Fieldbrook St
- 2634 Blandford Dr
- 18654 Del Bonita St
- 2521 Doubletree Ln
- 3038 Blakeman Ave
- 2503 Abonado Place
- 18851 Amberly Place
- 18536 Mescal St
- 18559 Stonegate Ln
- 2426 Batson Ave
- 2445 Desire Ave
- 18918 Kensley Place
- 18489 Stonegate Ln
- 2432 Desire Ave
- 2306 Doubletree Ln
- 2517 Windsor Place
- 2353 Almeza Ave
- 2572 Carlton Place
- 2270 Paso Real Ave
- 2818 Kinnow Place
- 2826 Kinnow Place
- 2812 Kinnow Place
- 18519 Klum Place
- 18527 Klum Place
- 2830 Kinnow Place
- 18531 Klum Place
- 18515 Klum Place
- 18535 Klum Place
- 18507 Klum Place
- 2808 Kinnow Place
- 2817 Kinnow Place
- 18539 Klum Place
- 2811 Kinnow Place
- 18503 Klum Place
- 2823 Kinnow Place
- 2802 Kinnow Place
- 18543 Klum Place
- 2807 Kinnow Place
- 18501 Klum Place