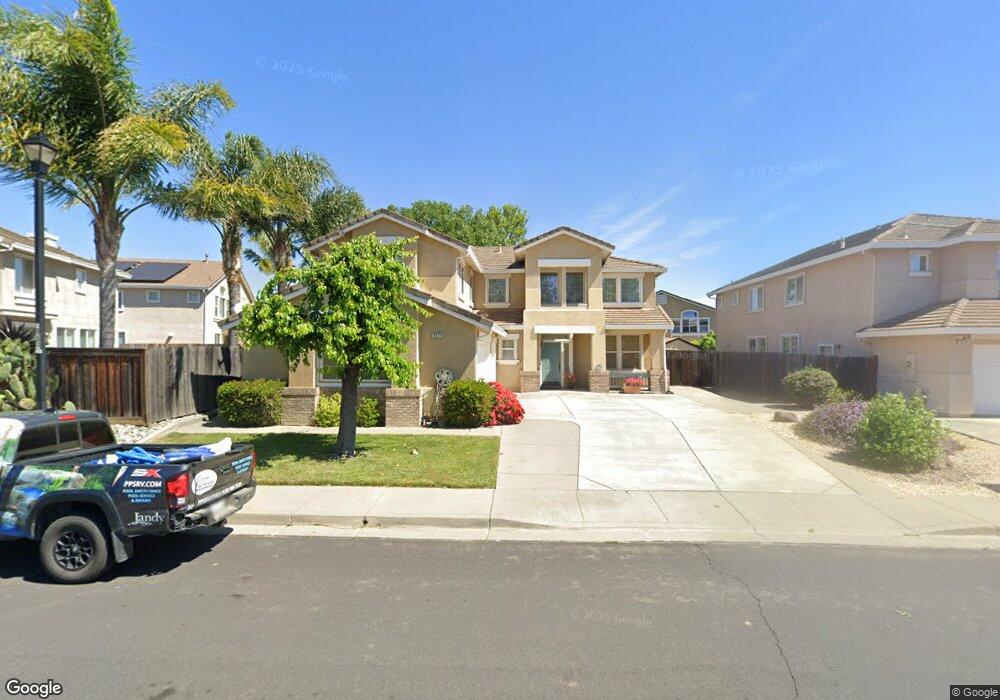
2822 Regatta Cir Fairfield, CA 94533
Estimated Value: $663,471 - $760,000
4
Beds
3
Baths
2,773
Sq Ft
$263/Sq Ft
Est. Value
About This Home
This home is located at 2822 Regatta Cir, Fairfield, CA 94533 and is currently estimated at $730,618, approximately $263 per square foot. 2822 Regatta Cir is a home located in Solano County with nearby schools including Laurel Creek Elementary School, Grange Middle School, and Fairfield High School.
Ownership History
Date
Name
Owned For
Owner Type
Purchase Details
Closed on
Nov 20, 2024
Sold by
Chang Pat Ni and Chang Lisa Mun
Bought by
Chang Family Trust and Chang
Current Estimated Value
Purchase Details
Closed on
Feb 28, 2010
Sold by
Flores Moises D and Flores Norma B
Bought by
Chang Pat Ni and Chang Lisa Mun Kiu Lo
Home Financials for this Owner
Home Financials are based on the most recent Mortgage that was taken out on this home.
Original Mortgage
$217,000
Interest Rate
4.97%
Mortgage Type
New Conventional
Purchase Details
Closed on
Oct 25, 2001
Sold by
Woodlake Lp
Bought by
Flores Moises D and Flores Norma B
Home Financials for this Owner
Home Financials are based on the most recent Mortgage that was taken out on this home.
Original Mortgage
$275,800
Interest Rate
6.84%
Create a Home Valuation Report for This Property
The Home Valuation Report is an in-depth analysis detailing your home's value as well as a comparison with similar homes in the area
Home Values in the Area
Average Home Value in this Area
Purchase History
| Date | Buyer | Sale Price | Title Company |
|---|---|---|---|
| Chang Family Trust | -- | None Listed On Document | |
| Chang Family Trust | -- | None Listed On Document | |
| Chang Pat Ni | $310,000 | Fidelity National Title Co | |
| Flores Moises D | $368,000 | Chicago Title Co |
Source: Public Records
Mortgage History
| Date | Status | Borrower | Loan Amount |
|---|---|---|---|
| Previous Owner | Chang Pat Ni | $217,000 | |
| Previous Owner | Flores Moises D | $275,800 | |
| Closed | Flores Moises D | $50,000 |
Source: Public Records
Tax History
| Year | Tax Paid | Tax Assessment Tax Assessment Total Assessment is a certain percentage of the fair market value that is determined by local assessors to be the total taxable value of land and additions on the property. | Land | Improvement |
|---|---|---|---|---|
| 2025 | $4,555 | $400,140 | $129,073 | $271,067 |
| 2024 | $4,555 | $392,295 | $126,544 | $265,751 |
| 2023 | $5,609 | $384,604 | $124,063 | $260,541 |
| 2022 | $5,557 | $377,064 | $121,631 | $255,433 |
| 2021 | $5,515 | $369,672 | $119,247 | $250,425 |
| 2020 | $5,415 | $365,883 | $118,025 | $247,858 |
| 2019 | $5,313 | $358,710 | $115,711 | $242,999 |
| 2018 | $5,650 | $351,678 | $113,443 | $238,235 |
| 2017 | $5,457 | $344,783 | $111,219 | $233,564 |
| 2016 | $5,428 | $338,024 | $109,039 | $228,985 |
| 2015 | $5,165 | $332,948 | $107,402 | $225,546 |
| 2014 | $5,131 | $326,427 | $105,299 | $221,128 |
Source: Public Records
Map
Nearby Homes
- 1336 Renewal Ln
- 2913 Willow Ct
- 1121 Willow Ln
- 1328 Horizon Cir
- 1508 Millennium Way
- 1512 Millennium Way
- 1516 Millennium Way
- 1520 Millennium Way
- 1532 Millennium Way
- 2913 Balsam Ct
- 1552 Millennium Way
- 1464 Descanso Ln
- 2612 Newberry St
- 2915 Shaver St
- 2972 Newberry Ct
- 2645 Newberry St
- 1571 Tommy Ln
- 3045 Balance Cir
- 1468 Monument Ln
- 1476 Monument Ln
- 2818 Regatta Cir
- 2838 Regatta Cir
- 2842 Regatta Cir
- 2855 Rebecca Dr
- 2814 Regatta Cir
- 2851 Rebecca Dr
- 2846 Regatta Cir
- 2821 Regatta Cir
- 2863 Rebecca Dr
- 2817 Regatta Cir
- 2810 Regatta Cir
- 2847 Rebecca Dr
- 2813 Regatta Cir
- 2867 Rebecca Dr
- 2837 Regatta Cir Unit 1
- 2829 Regatta Cir
- 2841 Regatta Cir
- 2843 Rebecca Dr
- 2809 Regatta Cir
- 2845 Regatta Cir Unit 1
Your Personal Tour Guide
Ask me questions while you tour the home.