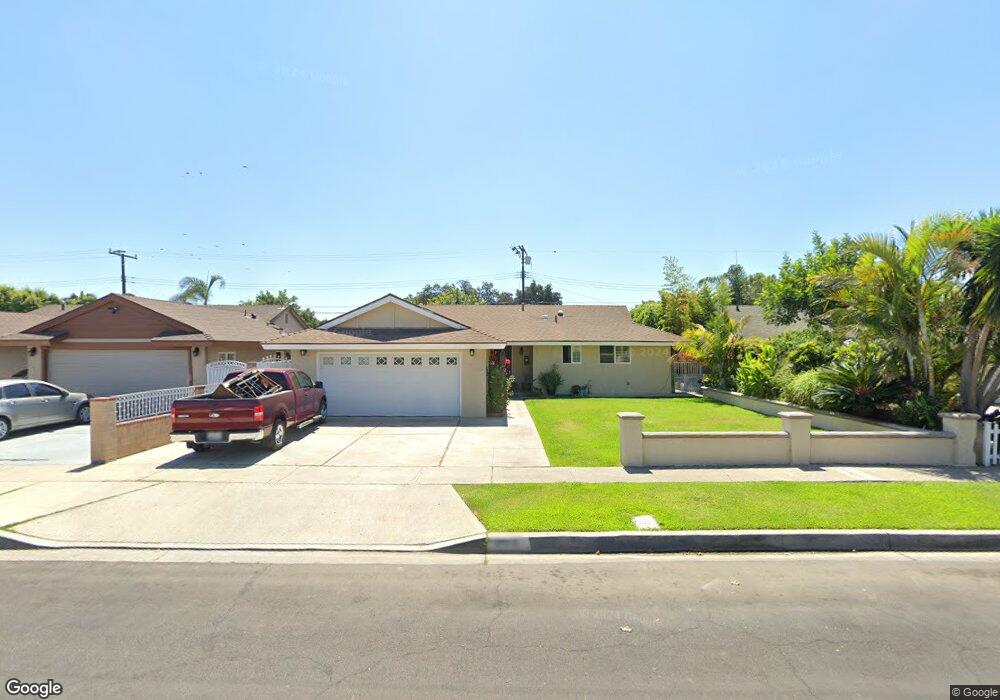
2822 W Camden Place Santa Ana, CA 92704
Centennial Park NeighborhoodEstimated Value: $811,455 - $921,000
3
Beds
2
Baths
1,031
Sq Ft
$830/Sq Ft
Est. Value
About This Home
This home is located at 2822 W Camden Place, Santa Ana, CA 92704 and is currently estimated at $855,614, approximately $829 per square foot. 2822 W Camden Place is a home located in Orange County with nearby schools including Adams Elementary School, Gerald P. Carr Intermediate School, and Valley High School.
Ownership History
Date
Name
Owned For
Owner Type
Purchase Details
Closed on
Dec 23, 2004
Sold by
Garibay Crisanto M
Bought by
Garibay Rosa Mirna
Current Estimated Value
Home Financials for this Owner
Home Financials are based on the most recent Mortgage that was taken out on this home.
Original Mortgage
$190,000
Outstanding Balance
$95,216
Interest Rate
5.74%
Mortgage Type
New Conventional
Estimated Equity
$760,398
Purchase Details
Closed on
Dec 8, 1999
Sold by
Alicia Reynoza Dora and Nery Alvarez Nery
Bought by
Garibay Crisanto M and Garibay Rosa Mirna
Purchase Details
Closed on
Nov 17, 1997
Sold by
Martin Montes and Martin Norma
Bought by
Reynoza Dora Alicia and Alvarez Nery
Home Financials for this Owner
Home Financials are based on the most recent Mortgage that was taken out on this home.
Original Mortgage
$131,450
Interest Rate
7.16%
Mortgage Type
FHA
Purchase Details
Closed on
Sep 5, 1997
Sold by
Pantoja Ismael and Rios Sergio
Bought by
Montes Martin and Montes Norma
Create a Home Valuation Report for This Property
The Home Valuation Report is an in-depth analysis detailing your home's value as well as a comparison with similar homes in the area
Home Values in the Area
Average Home Value in this Area
Purchase History
| Date | Buyer | Sale Price | Title Company |
|---|---|---|---|
| Garibay Rosa Mirna | -- | Southland Title | |
| Garibay Crisanto M | -- | -- | |
| Reynoza Dora Alicia | $133,000 | Chicago Title Co | |
| Montes Martin | -- | Fidelity National Title Ins |
Source: Public Records
Mortgage History
| Date | Status | Borrower | Loan Amount |
|---|---|---|---|
| Open | Garibay Rosa Mirna | $190,000 | |
| Previous Owner | Reynoza Dora Alicia | $131,450 |
Source: Public Records
Tax History Compared to Growth
Tax History
| Year | Tax Paid | Tax Assessment Tax Assessment Total Assessment is a certain percentage of the fair market value that is determined by local assessors to be the total taxable value of land and additions on the property. | Land | Improvement |
|---|---|---|---|---|
| 2025 | $3,162 | $261,276 | $186,773 | $74,503 |
| 2024 | $3,162 | $256,153 | $183,110 | $73,043 |
| 2023 | $3,081 | $251,131 | $179,520 | $71,611 |
| 2022 | $3,045 | $246,207 | $176,000 | $70,207 |
| 2021 | $2,974 | $241,380 | $172,549 | $68,831 |
| 2020 | $2,977 | $238,905 | $170,779 | $68,126 |
| 2019 | $2,920 | $234,221 | $167,430 | $66,791 |
| 2018 | $2,811 | $229,629 | $164,147 | $65,482 |
| 2017 | $2,785 | $225,127 | $160,928 | $64,199 |
| 2016 | $2,730 | $220,713 | $157,772 | $62,941 |
| 2015 | $2,694 | $217,398 | $155,402 | $61,996 |
| 2014 | $2,646 | $213,140 | $152,358 | $60,782 |
Source: Public Records
Map
Nearby Homes
- 2424 S Laurelwood Unit 143
- 3510 & 3512 W Pine St
- 2513 W Occidental St
- 2309 W Anahurst Place
- 2970 C S Greenville St
- 2521 W Stanford St
- 2849 S Fairview St Unit H
- 2718 S Griset Place
- 2108 S Artesia St
- 2029 W Flora St
- 12143 Sylvan River Unit 147
- 2813 S Fairview St Unit G
- 2926 W La Verne Ave
- 2875 S Fairview St Unit B
- 12061 Brighton River Unit 37
- 2730 W Segerstrom Ave Unit D
- 2610 W Segerstrom Ave Unit B
- 1838 S Artesia St
- 2710 W Segerstrom Ave Unit D
- 11872 Goodale Ave
- 2816 W Camden Place
- 2828 W Camden Place
- 2031 S Fairview St
- 2813 W Saint Gertrude Place
- 2810 W Camden Place
- 2832 W Camden Place
- 2809 W Saint Gertrude Place
- 2035 S Fairview St
- 2823 W Camden Place
- 2817 W Camden Place
- 2805 W Saint Gertrude Place
- 2806 W Camden Place
- 2027 S Fairview St
- 2813 W Camden Place
- 2801 W Saint Gertrude Place
- 2807 W Camden Place
- 2742 W Camden Place
- 2021 S Fairview St
- 2818 W Harvard St
- 2824 W Harvard St